
Description
🚀 Plus de 10 000 traders utilisent déjà nos MEILLEURS indicateurs🏆
👉 Obtenez tous nos MEILLEURS systèmes ici :
_______________________________________________
📌 Indicateurs de structure de marché
· ✅ AdvancedMarket Structure : Bos, Choch, SwinLevels, Order Blocks, Market Structure& Liquidity Finder
· 🔄 Analyse dynamique de la structure du marché des points de retournement
· 🧱 Bloc d'ordre
· ⛓️ BOS & CHOCH
· 🧠 ICT Power of 3
· 🌀 Zones de polarité du marché
_______________________________________________
🔚 Systèmes de sortie intelligents
· 📍 Algorithme intelligent de suivi
_______________________________________________
📐 Indicateurs ZigZag
· 🔍 Projection de liquidité des prix ZigZag
· ➖ ZigZag
· 🎯 Suivi des extrémités Zig-Zag
_______________________________________________
🧱 Indicateurs de support et de résistance
· 🟩 Lignes de support et de résistance SmartTrend
· 🧱 Tous les niveaux de support et de résistance
_______________________________________________
📊 Indicateurs de tendance et de canal
· 🔄 Canal de tendance automatique
· 📊 Supertrend
· ⚡Analyseur de tendance Momentum
· 🧠 Canal de tendance adaptatif
· 💥 Système de cassure de canal
· 🌈 Gradient de tendance dynamique
_______________________________________________
💧 Outils de volume et de liquidité
· 🔥 Carte thermique Volume POC
· 📉 Carte de liquidation à effet de levier
· 🔍 Écart de valeur équitable Momentum
· 🕒 Sessions d'écart de valeur équitable
_______________________________________________
⚡ Indicateurs Momentum & RSI
· 📈 Déclencheur de tendance RSI
· 🚀 Momentum de plage dynamique
· 🔎 Biais de chandelle multi-niveaux
Suivi
_______________________________________________
🔮 Outils de prédiction et de projection
· 📐 Prédiction basée sur Linreg & ATR
· 📏 Régression linéaire Fibonacci Multi-échelles
· 📈 Projecteur de flux de marché alimenté par le volume
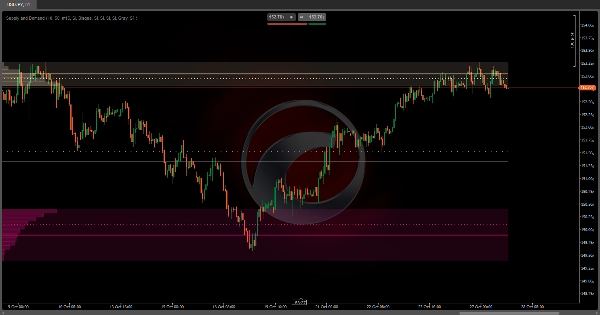
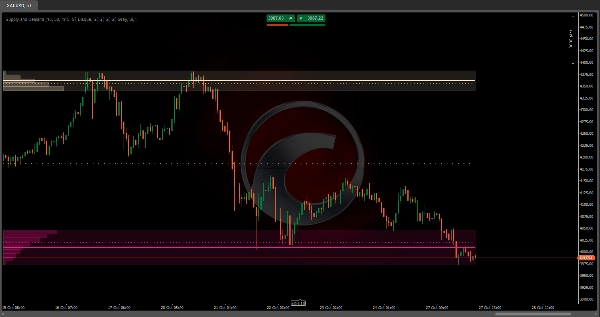
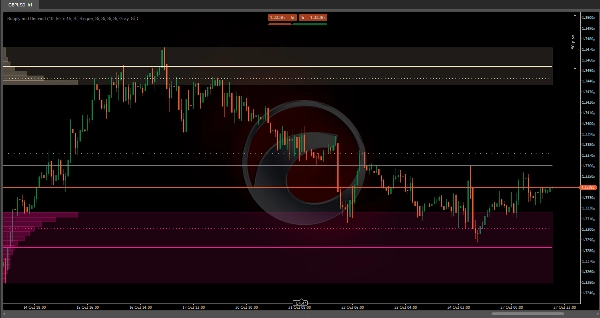
Offre et demande automatiques : 💹
Offre et demande automatiques est un indicateur avancé d'analyse de volume qui identifie automatiquement les zones d'activité de trading les plus élevées sur votre graphique. 📊 Contrairement à d'autres indicateurs statiques, celui-ci s'ajuste dynamiquement à la plage visuelle que vous observez, recalculant les zones à chaque fois que vous zoomez ou faites défiler le graphique.
Comment ça fonctionne ? ❓
L'algorithme divise la plage de prix visible en plusieurs niveaux horizontaux (configurables de 2 à 500 divisions) et analyse le volume échangé à chaque niveau. Pour une plus grande précision, il utilise des données d'une unité de temps inférieure à celle que vous observez. 🕒 Par exemple, si vous regardez un graphique horaire, il peut analyser des chandelles de 15 minutes pour détecter plus en détail où le volume a réellement été concentré.
Le processus d'identification 🔍
L'indicateur travaille des extrêmes vers le centre :
- Depuis le prix le plus élevé : 🚀 Il commence au plus haut de la plage visible et descend niveau par niveau, accumulant le volume échangé dans chaque bande de prix.
- Depuis le prix le plus bas : 📉 Simultanément, il remonte depuis le bas, accumulant le volume dans une direction ascendante.
- Seuil d'activation : ⚡ Lorsqu'une de ces zones accumule un pourcentage spécifique du volume total (configurable, 10 % par défaut), elle est marquée comme zone significative et la recherche dans cette direction s'arrête.
- Zone médiane : ⚖️ Une fois les deux zones (supérieure et inférieure) identifiées, l'espace intermédiaire est marqué comme zone neutre ou d'équilibre.
À quoi ça sert ? 🎯
Cet indicateur est un outil d'analyse de la structure du marché qui vous aide à :
- Identifier les zones d'offre : 🏔️ Zones supérieures où il y a eu historiquement une forte activité de vente.
- Identifier les zones de demande : 🏖️ Zones inférieures où l'activité d'achat était concentrée.
- Détecter les zones d'équilibre : 🎭 La plage médiane où la pression d'achat et de vente s'équilibre.
Ces zones ont tendance à agir comme des aimants pour le prix à l'avenir, car elles représentent des niveaux où de nombreux participants ont pris position. 🧲
Comment peut-il être combiné ? 🔗
Avec des stratégies d'action sur le prix :
- Attendez les retests des zones identifiées pour rechercher des confirmations de retournement.
- Utilisez les zones comme objectifs de prise de profit ou placement de stop-loss.
Avec des indicateurs de tendance :
- Dans une tendance haussière, recherchez des entrées lorsque le prix reteste la zone inférieure de demande. 📈
- Dans une tendance baissière, utilisez la zone supérieure d' offre comme résistance pour les ventes. 📉
Avec l'analyse multi-échelles :
- Identifiez les zones sur des unités de temps supérieures et recherchez des confirmations sur des unités de temps inférieures.
- Les zones d'une unité de temps supérieure peuvent contenir plusieurs zones sur des unités de temps inférieures.
Avec des indicateurs de momentum :
- Combinez avec RSI ou Stochastique pour confirmer les conditions de surachat/survente dans les zones.
- Les divergences dans les zones d'offre/demande peuvent signaler des retournements potentiels.
Configuration personnalisable ⚙️
L'indicateur vous permet d'ajuster complètement chaque zone indépendamment :
- Activez/désactivez chaque élément visuel (zones, lignes moyennes, lignes pondérées).
- Seuil de volume : Quel pourcentage du volume total doit être accumulé pour considérer une zone comme significative.
- Divisions de prix : Un nombre plus élevé = plus de précision mais plus de calculs.
- Unité de temps inférieure : Définit la granularité de l'analyse de volume.
Caractéristique clé : adaptation automatique 🔄
Recalcul automatique basé sur votre vue. Cela signifie que :
- Si vous zoomez pour voir le détail d'une session, il identifiera les zones spécifiques d'offre et de demande pour ces heures.
- Si vous dézoomez pour voir des semaines ou des mois, il recalculera les macro-zones pour toute la période.
- Chaque fois que vous faites défiler le graphique, les zones se mettent à jour pour refléter le contexte de la plage visible.
Résumé
The indicator divides the visible price range into configurable horizontal levels (2 to 500 divisions) and analyzes volume traded at each level using data from a lower timeframe than the chart’s timeframe for enhanced accuracy. It identifies significant zones by accumulating volume from the highest and lowest visible prices until a configurable volume threshold (default 10%) is reached, marking these as supply and demand zones respectively. The area between these zones is designated as a balance zone, representing equilibrium between buying and selling pressures.
These zones highlight areas of historically high trading activity that often act as future price magnets. The indicator supports customization of visual elements, volume thresholds, price divisions, and analysis timeframe. It can be combined with price action strategies, trend indicators, multiple timeframe analysis, and momentum indicators like RSI or Stochastic to improve trade entries, exits, and confirmations.
Supported markets include Forex, Indices, Commodities, Stocks, and Cryptocurrencies, with symbols such as EURUSD, GBPUSD, BTCUSD, XAUUSD, and NAS100.
Avis clients
5 | 50 % | |
4 | 0 % | |
3 | 0 % | |
2 | 0 % | |
1 | 50 % |


![Logo de "Gaussian Channel [Iridio Capital]"](https://cdn.ctrader.com/image/webp/7c039209-5573-4a54-a072-f9528b503103_41960)


