
Description
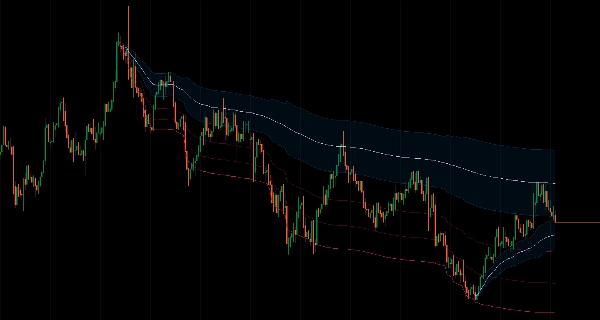
Verrouillez le calcul de la moyenne mobile à n'importe quel moment du marché et suivez le comportement des prix à mesure qu'il s'étend vers l'avant.
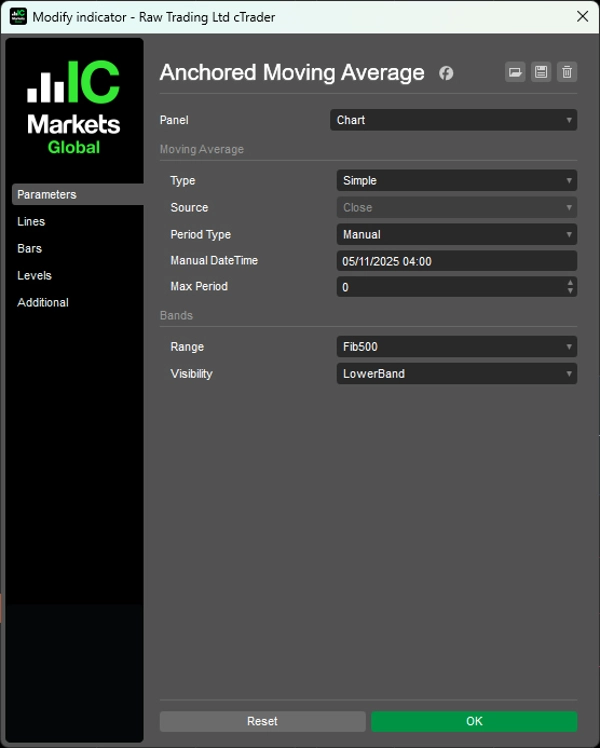
Ancre le calcul à votre point de départ choisi (date et heure manuelles ou période de retour en arrière de 1 heure à 10 ans), puis se développe naturellement avec des bandes de Fibonacci adaptatives basées sur la plage de prix réelle.
Huit niveaux de Fibonacci (11,4 % à 100 %) qui s'adaptent au mouvement réel des prix, zone de reversion moyenne intégrée de 38,2 % à 62,8 %, deux types de MM (SMA/EMA), plusieurs modes d'affichage (bandes complètes, seules les limites extrêmes, uniquement la zone de reversion), et limiteur de période maximale pour les longues périodes offrent un suivi du momentum basé sur les événements pour les traders ciblant les retracements à partir de points de retournement significatifs et l'analyse du comportement des prix post-événement.
CARACTÉRISTIQUES
Calcul Ancré dans le Temps
- Contrairement aux MM standard qui utilisent des périodes fixes, celle-ci se développe naturellement à partir de votre point de départ choisi
- Ancrage flexible : définissez une date et heure manuelles ou utilisez des périodes de retour en arrière prédéfinies (1 heure à 10 ans)
- Suivez le momentum à partir de moments significatifs du marché
- Points d'ancrage cohérents à travers différents intervalles de temps
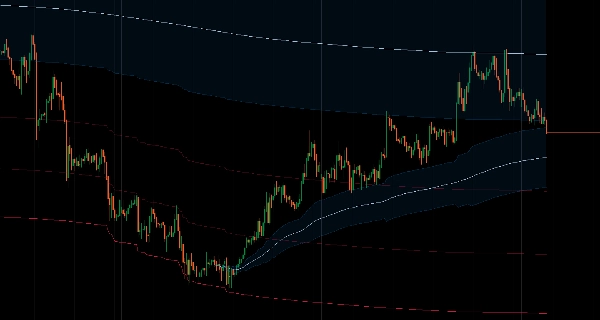
Bandes de Fibonacci Adaptatives
- Bandes calculées automatiquement basées sur la plage de prix réelle, pas sur des multiples arbitraires de l'ATR
- 8 niveaux de Fibonacci (11,4 % à 100 %) qui s'adaptent au mouvement réel des prix
- Zones de reversion moyenne : zone de reversion intégrée de 38,2 % à 62,8 % pour des zones d'entrée à haute probabilité
- Zones de probabilité définies mathématiquement
Deux Types de MM
- Moyenne Mobile Simple
- Moyenne Mobile Exponentielle
- Limiteur de période maximale : évite un lissage excessif sur les longues périodes
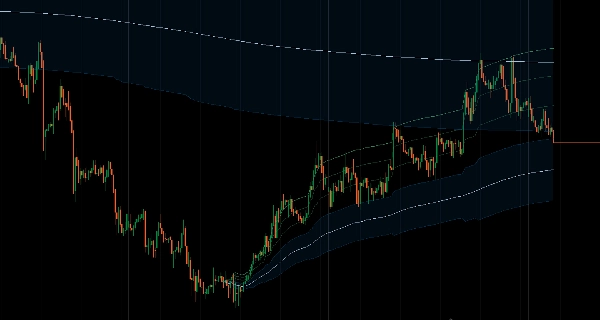
Modes d'Affichage Multiples
- Bandes complètes : tous les niveaux de Fibonacci visibles
- Haut/bas uniquement : affiche les limites extrêmes
- Zone de reversion uniquement : concentrez-vous sur la zone de reversion moyenne
- Design épuré et ciblé sans encombrement
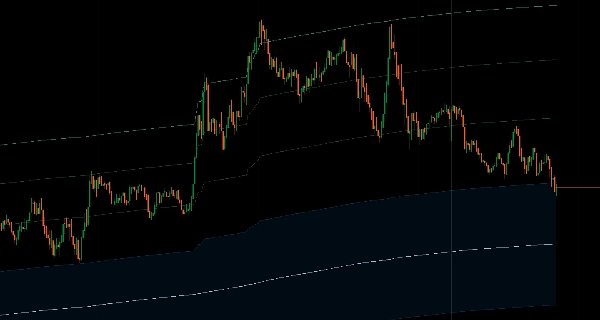
Analyse Basée sur les Événements
- Voyez comment le prix actuel se rapporte au mouvement à partir de niveaux significatifs
- Suivez le comportement des prix après l'événement
- Entrées basées sur la structure avec des points de référence clairs
__________________________________________________________________________________________
PLUS D'INDICATEURS GRATUITS
Explorez une large gamme d'outils d'analyse de marché — de la structure et du volume à la régression, la volatilité et les intervalles personnalisés.
Le code source est disponible sur le dépôt GitHub.
Tous gratuits à utiliser. Mais si vous souhaitez offrir un café en soutien, vous pouvez le faire ici.
Support/Résistance
Volume
- Profileur d'Activité de Volume
- Analyseur d'Efficacité du Volume
- Analyse du Profil de Volume
- Profil de Volume - Mis à Jour
- Analyse de la Répartition du Volume
- VWAP (Prix Moyen Pondéré par le Volume)
Moyennes Mobiles
- Canal SSL
- Moyenne Mobile Ancrée
- Moyenne Mobile Échelonnée par Écart
- Activateur Haut Bas de Gann
- Ligne de Tendance Instantanée
- MA Adaptative de Kaufman avec Vision de Tendance
- Canal de Moyenne Mobile
- Suite de Moyennes Mobiles
- Moyenne Mobile du Canal de Tendance
Utilitaires/Personnalisés
Basé sur la Régression
Volatilité
Oscillateurs
__________________________________________________________________________________________
AVERTISSEMENT
Le trading comporte des risques. Cet indicateur est destiné uniquement à l'analyse technique — appliquez toujours une gestion appropriée des risques et tradez de manière responsable.
RETROACTION & AMÉLIORATIONS
Si vous avez des suggestions, des demandes de fonctionnalités ou des idées d'amélioration, veuillez laisser un commentaire dans l'onglet Discussion. Vos retours aident à améliorer l'indicateur pour tous.
Résumé
The indicator features adaptive Fibonacci bands calculated based on the actual price range, not arbitrary multiples. It includes eight Fibonacci levels from 11.4% to 100%, with a built-in mean reversion zone between 38.2% and 62.8%, providing mathematically defined probability zones for potential entry areas. Multiple display modes are available, including full bands, extreme boundaries only, or reversion zone only, designed for a clean and purposeful chart presentation.
This tool facilitates analysis of price behavior relative to significant swing points or events, supporting structured entries and post-event price tracking. It is intended for technical analysis and includes a disclaimer advising responsible trading with proper risk management.
Avis clients
5 | 100 % | |
4 | 0 % | |
3 | 0 % | |
2 | 0 % | |
1 | 0 % |


