Description
Système de Trailing Adaptatif 🚀
Le Système de Trailing Adaptatif est un trailing stop adaptatif avancé qui utilise la volatilité normalisée logarithmique pour ajuster automatiquement les niveaux de protection des profits. 📊 Contrairement aux trailing stops traditionnels avec des distances fixes, ce système calcule des distances dynamiques basées sur la volatilité réelle du marché, s’adaptant constamment aux conditions changeantes. 🔄
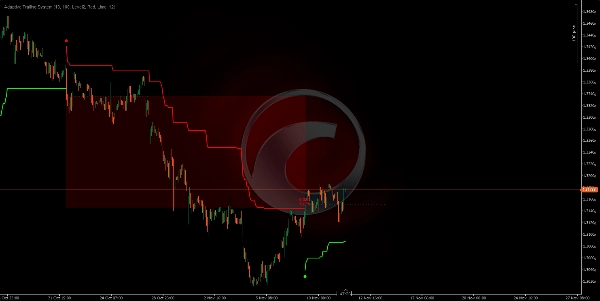
Spotware GBPUSD 691360763c684 | cTrader
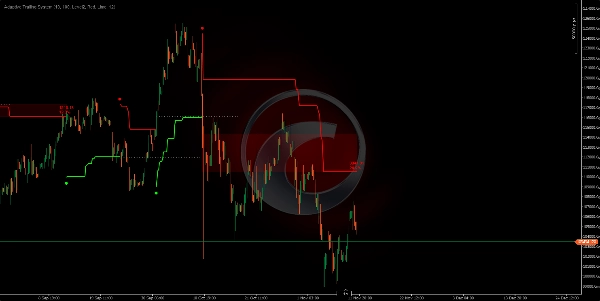
Spotware XAUUSD 691360adf1386 | cTrader
Spotware XAUUSD 691360adf1386 | cTrader
Algorithme Unique de Trailing Adaptatif ⚙️
Le système utilise une méthode statistique qui ne génère jamais les mêmes distances de trailing :
• Calcule la True Range du prix sur une période configurable.
• Applique une transformation logarithmique à ces valeurs pour normaliser la distribution.
• Calcule la moyenne et l’écart-type de ces valeurs logarithmiques.
• Génère une distance de décalage unique basée sur les niveaux de volatilité (0, 1, 2 ou 3 écarts-types). 🎯
• Le trailing stop est continuellement ajusté en utilisant le prix typique (moyenne du Haut, Bas, Clôture).
Résultat : Chaque instant du marché a sa propre distance de trailing, calculée selon la volatilité spécifique de ce contexte. 🤖
Fondement Technique : Volatilité Normalisée Logarithmique 🧠
Pourquoi une transformation logarithmique ? 🤔
La volatilité du marché ne suit pas une distribution normale (gaussienne) ; elle tend à avoir des valeurs extrêmes. La transformation logarithmique :
- Normalise la distribution : Convertit des données biaisées en une distribution plus symétrique.
- Stabilise la variance : Réduit l’impact des pics extrêmes de volatilité.
- Permet la comparaison statistique : Rend possible l’utilisation significative de l’écart-type.
Processus de Calcul du Décalage 🔢
- True Range de la période : Mesure la plage maximale, en tenant compte du Haut-Bas de la période et des gaps avec la clôture précédente.
- Logarithme naturel : Applique
ln(True Range)pour normaliser. - Fenêtre de normalisation : Conserve les N dernières valeurs logarithmiques (période de normalisation).
- Moyenne logarithmique : Moyenne de toutes les valeurs
ln(TR)dans la fenêtre. - Écart-type : Calcule la dispersion des valeurs logarithmiques.
- Niveau de volatilité : Multiplie l’écart par 0, 1, 2 ou 3 selon la configuration.
- Décalage final :
Offset = e^(mean + level × deviation)- convertit de nouveau à l’échelle des prix. 💡
Comment ça marche ? ⚡
Mécanique de Trailing Bidirectionnelle
Le système fonctionne en deux modes alternés :
Mode BAISSIER (Short) : 📉
• Le trailing stop est placé AU-DESSUS du prix.
• Il se met à jour à la baisse lorsque le prix baisse (ne monte jamais).
• Signal de retournement lorsque le prix FERME au-dessus du trailing stop.
Mode HAUSSIER (Long) : 📈
• Le trailing stop est placé EN-DESSOUS du prix.
• Il se met à jour à la hausse lorsque le prix monte (ne baisse jamais).
• Signal de retournement lorsque le prix FERME en dessous du trailing stop.
Signaux de Retournement :
• Un point circulaire marque le changement de tendance (entrée d’une nouvelle position).
• Couleur verte = Nouvelle tendance haussière (). ✅
• Couleur rouge = Nouvelle tendance baissière (). 🔴
Paramètres et Impact 🎛️
Période de Calcul (10)
- Fonction : Définit combien de barres sont utilisées pour calculer le True Range.
- ↑ Plus élevé (20-50) : Mesure la volatilité à plus long terme, plus lisse, moins sensible.
- ↓ Plus bas (5-8) : Mesure la volatilité à court terme, plus réactif, détecte les changements rapides.
Période de Normalisation (100)
- Fonction : Fenêtre des valeurs logarithmiques pour calculer la moyenne et l’écart-type.
- ↑ Plus élevé (200-500) : Normalisation plus stable, changements graduels du décalage.
- ↓ Plus bas (50-80) : Normalisation plus réactive, le décalage s’adapte plus rapidement.
- Impact Critique : Ce paramètre détermine à quel point le contexte historique de volatilité est "mémorisé". 🧠
Niveau de Volatilité (Niveau 2)
- Fonction : Nombre d’écarts-types appliqués au calcul du décalage.
- Niveau 0 (0σ) : Décalage = moyenne logarithmique = distance la plus serrée, sensibilité maximale. 🎯
- Niveau 1 (1σ) : Décalage inclut 1 écart = distance modérée, capture ~68% de la variation.
- Niveau 2 (2σ) : Décalage inclut 2 écarts = distance plus large, capture ~95% de la variation (équilibré). ⚖️
- Niveau 3 (3σ) : Décalage inclut 3 écarts = distance très large, capture ~99% de la variation, tolérance maximale. 🛡️
___________________________________________________________________________________________________
🚀 Plus de 10 000 traders utilisent déjà nos MEILLEURS indicateurs🏆
👉 Obtenez tous nos MEILLEURS systèmes ici :
_______________________________________________
📌 Indicateurs de Structure de Marché
· ✅ AdvancedMarket Structure: Bos, Choch, SwinLevels, Order Blocks, Market Structure& Liquidity Finder
· 🔄 Dynamic Market StructureAnalysis of Turning Points
· 🧱 Order Block
· ⚖️ Market Imbalance
· ⛓️ BOS & CHOCH
· 🧠 ICT Power of 3
_______________________________________________
🔚 Systèmes de Sortie Intelligents
_______________________________________________
📐 Indicateurs ZigZag
· 🔍 ZigZag Price LiquidityProjection
· ➖ ZigZag
_______________________________________________
🧱 Indicateurs de Support & Résistance
· 🟩 SmartTrend Support &Resistance Lines
· 🧱 All Support and ResistanceLevels
_______________________________________________
📊 Indicateurs de Tendance & Canal
· 📊 Supertrend
_______________________________________________
💧 Outils de Volume & Liquidité
_______________________________________________
⚡ Indicateurs Momentum & RSI
· 🔎 Multi-Level Candle Bias
Tracker
_______________________________________________
🔮 Outils de Prédiction & Projection
· 📐 Prédiction Basée sur Linreg& ATR
· 📏 Régression Linéaire FibonacciMulti-timeframe
· 📈 Projecteur de Flux de Marché Alimenté par le Volume_________________________________________________________________________________________________
Résumé
The system operates bidirectionally with two modes:
- Bearish (short) mode places the trailing stop above the price, adjusting downward as price falls, signaling a reversal when price closes above the stop.
- Bullish (long) mode places the trailing stop below the price, adjusting upward as price rises, signaling a reversal when price closes below the stop.
Reversal signals are visually marked with colored dots indicating trend changes (green for bullish, red for bearish). Key parameters include the calculation period for True Range, normalization period for volatility data, and volatility level defining the offset distance based on standard deviations.
This indicator supports various markets including Forex, cryptocurrencies, commodities, indices, and stocks, with symbols such as BTCUSD, EURUSD, GBPUSD, XAUUSD, NAS100, and USDJPY. It is designed to provide adaptive trailing stops that respond to real-time volatility, enhancing trade exit strategies.