
Opis
🚀 Ponad 10 000 traderów już korzysta z naszych NAJLEPSZYCH wskaźników🏆
👉 Pobierz wszystkie nasze NAJLEPSZE systemy tutaj:
_______________________________________________
📌 Wskaźniki Struktury Rynku
· ✅ AdvancedMarket Structure: Bos, Choch, SwinLevels, Order Blocks, Market Structure& Liquidity Finder
· 🔄 Dynamic Market StructureAnalysis of Turning Points
· 🧱 Order Block
· ⚖️ Market Imbalance
· ⛓️ BOS & CHOCH
· 🧠 ICT Power of 3
_______________________________________________
🔚 Inteligentne Systemy Wyjścia
_______________________________________________
📐 Wskaźniki ZigZag
· 🔍 ZigZag Price LiquidityProjection
· ➖ ZigZag
_______________________________________________
🧱 Wskaźniki Wsparcia i Oporu
· 🟩 SmartTrend Support &Resistance Lines
· 🧱 All Support and ResistanceLevels
_______________________________________________
📊 Wskaźniki Trendu i Kanału
· 📊 Supertrend
_______________________________________________
💧 Narzędzia Wolumenu i Płynności
_______________________________________________
⚡ Wskaźniki Momentum i RSI
· 🔎 Multi-Level Candle Bias
Tracker
_______________________________________________
🔮 Narzędzia Prognozowania i Projekcji
· 📐 Prediction Based on Linreg& ATR
· 📏 Fibonacci Linear RegressionMulti-timeframe
· 📈 Volume-Powered Market Flow Projector
________________________________________________________________________________________
SYGNAŁY PRZEŁAMANIA CHMURY ZMIENNOŚCI.
Ogólny Przegląd 💡
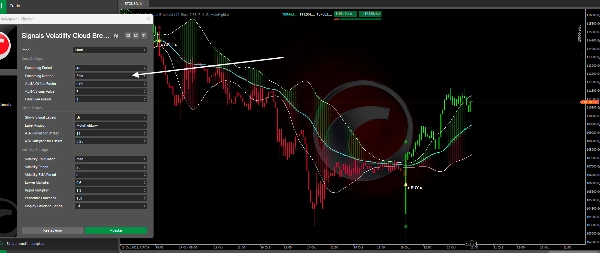
Adaptive Trend Bands to zaawansowany wskaźnik podążający za trendem, który łączy adaptacyjne filtrowanie cen z dynamicznymi pasmami zmienności. W przeciwieństwie do tradycyjnych statycznych wskaźników pasmowych, system ten automatycznie dostosowuje swoją czułość do zmieniających się warunków rynkowych, dostarczając dokładniejsze sygnały w różnych środowiskach zmienności. 🎯
Co robi ten wskaźnik? 🤔
Wskaźnik generuje filtrowaną i wygładzoną reprezentację ceny (OHLC), która eliminuje szumy rynkowe, pozwalając na wyraźniejsze zobrazowanie podstawowego trendu. Jednocześnie oblicza górne i dolne pasma, które automatycznie rozszerzają się lub kurczą w zależności od aktualnej zmienności, dostosowując się do spokojnych lub burzliwych rynków. 🌊
Kluczowe cechy: ✨
- Adaptacyjne filtrowanie cen za pomocą algorytmów ALMA lub EMA
- Pasma zmienności, które dynamicznie dostosowują się na podstawie historycznych percentyli
- Wizualne sygnały KUPNA/SPRZEDAŻY, gdy cena przekracza pasma 🟢🔴
- Kolorowanie świec na podstawie wykrytego trendu (zielony byczy / czerwony niedźwiedzi)
- Kolorowe chmury między filtrowanymi liniami do wizualizacji siły trendu 💪
Jak to działa? ⚙️
System filtrowania
Wskaźnik stosuje dwustopniowy proces wygładzania ceny:
- Pierwsza warstwa: Używa filtrów ALMA (Arnaud Legoux Moving Average) lub tradycyjnych EMA, aby wyeliminować krótkoterminowe wahania. ALMA jest szczególnie skuteczna, ponieważ redukuje opóźnienia przy zachowaniu płynności.
- Druga warstwa: Stosuje dodatkowe wygładzanie EMA do wyniku pierwszego filtra, tworząc ultra-gładką linię trendu, która reaguje w zrównoważony sposób na zmiany cen.
Adaptacyjne obliczanie zmienności 📏
System mierzy zmienność rynku za pomocą dwóch metod:
- Odchylenie standardowe (StdDev): Klasyczna metoda pomiaru rozproszenia
- Średnie odchylenie bezwzględne (MAD): Bardziej odporne na wartości ekstremalne
Obliczona zmienność jest wygładzana, a następnie porównywana z historią przeszłych zmienności, aby określić jej rangę percentylową. Ten percentyl kontroluje mnożnik pasma:
- Niska zmienność (niski percentyl): Pasma są bliżej ceny 🤏
- Wysoka zmienność (wysoki percentyl): Pasma są szersze, dając miejsce na ruch 🌐
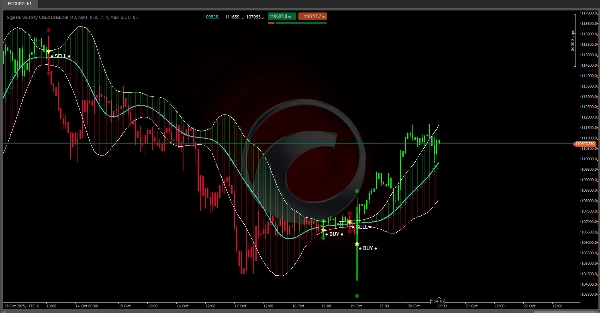
Generowanie sygnałów 🔔
Sygnały są aktywowane, gdy aktualna cena przekracza adaptacyjne pasma:
- Po aktywacji sygnału wskaźnik utrzymuje status trendu aż do wystąpienia przeciwnych przecięć, zapobiegając przedwczesnym sygnałom w strefach konsolidacji. 🛡️
Do czego to służy? 🛠️
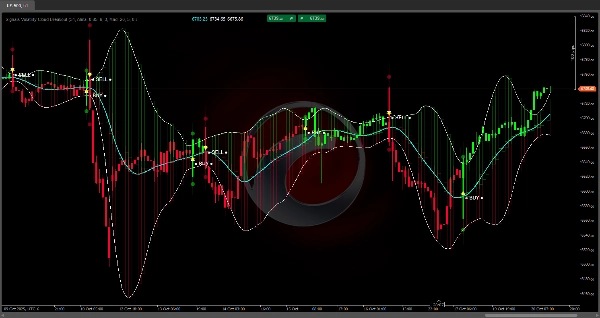
Identyfikacja trendu 👀
Wskaźnik koloruje świece zgodnie z kierunkiem wykrytego trendu, umożliwiając szybkie rozpoznanie, czy rynek znajduje się w fazie byczej czy niedźwiedziej. Kolorowe chmury między filtrowanymi liniami wizualnie wzmacniają siłę i kierunek ruchu.
Punkty wejścia i wyjścia ➡️🚪
Sygnały KUPNA/SPRZEDAŻY oznaczone wyraźnymi ikonami wskazują potencjalne momenty wejścia lub wyjścia z rynku. Sygnały te mają na celu uchwycenie początku trendów, gdy cena wykazuje wystarczający impet, aby pokonać adaptacyjne pasma.
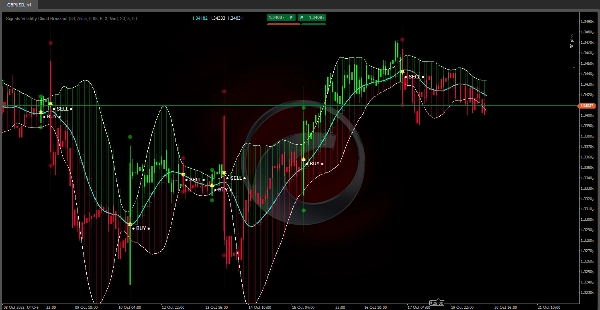
Zarządzanie pozycją 💼
Górne i dolne pasma służą jako poziomy odniesienia do:
- Określania dynamicznych stopów
- Identyfikacji względnych stref wykupienia/wyprzedania 🏷️
- Oceny, czy trend traci siłę (korekta ceny w kierunku linii centralnej) 📉
Podsumowanie
Key features include visual BUY/SELL signals triggered when price crosses the adaptive bands, candle coloring to indicate bullish or bearish trends, and colored clouds between filtered lines to represent trend strength. The bands also serve as dynamic reference levels for setting stops, identifying overbought or oversold conditions, and assessing trend strength. This indicator supports various markets including Forex, Crypto, Stocks, and symbols such as BTCUSD, EURUSD, GBPUSD, XAUUSD, and USDJPY. It is intended for trend identification, entry and exit timing, and position management within diverse trading environments.


