
설명
🚀 10,000명 이상의 트레이더가 이미 우리의 TOP 지표를 사용하고 있습니다🏆
전문가들이 왜 우리를 선택하는지 알아보세요 – 가장 강력한 도구들이 cTrader(지표, 알고리즘, cBots)에서 여러분을 기다리고 있습니다.
👉 모든 TOP 시스템을 여기에서 받으세요:
_______________________________________________
_______________________________________________
📌 시장 구조 지표
· ✅ AdvancedMarket Structure: Bos, Choch, SwinLevels, Order Blocks, Market Structure& 유동성 탐지기
· 🔄 동적 시장 구조전환점 분석
· 🧱 오더 블록
· ⚖️ 시장 불균형
· ⛓️ BOS & CHOCH
· 🧠 ICT 파워 오브 3
· 🌀 시장 극성 구역
______________________________________________________________-
스토어 cBots : 🧠 골드 & BTC 돌파세션 피벗 🧠
_______________________________________________
🔚 스마트 종료 시스템
· 📍 추적 스마트 알고리즘
_______________________________________________
📐 지그재그 지표
· 🔍 지그재그 가격 유동성 투영
· 🧭 S&R 구조적 지그재그
· ➖ 지그재그
· 🎯 지그재그 극단 추적기
_______________________________________________
🧱 지지 및 저항 지표
· 🟩 스마트트렌드 지지 및 저항선
· 🧱 모든 지지 및 저항 레벨
_______________________________________________
📊 추세 및 채널 지표
· 🔄 자동 추세 채널
· 📊 슈퍼트렌드
· ⚡모멘텀 추세 분석기
· 🧠 적응형 추세 채널
· 💥 채널 돌파 시스템
· 🌈 동적 추세 그라디언트
· ⭐ 프리미엄 SSL 채널
· 🔁 반응형 이동 평균
_______________________________________________
💧 거래량 및 유동성 도구
· 🔥 거래량 POC 히트맵
· 📉 레버리지 청산 맵
· 🔍 모멘텀 공정 가치 갭
· 🕒 공정 가치 갭 세션
_______________________________________________
⚡ 모멘텀 및 RSI 지표
· 📈 RSI 추세 트리거
· 🚀 동적 범위 모멘텀
_______________________________________________
🔮 예측 및 투영 도구
· 📈 거래량 기반 시장 흐름 투영기
📉 피보나치 피치팬
_________________________________________________________________________________
_________________________________________________________________________________
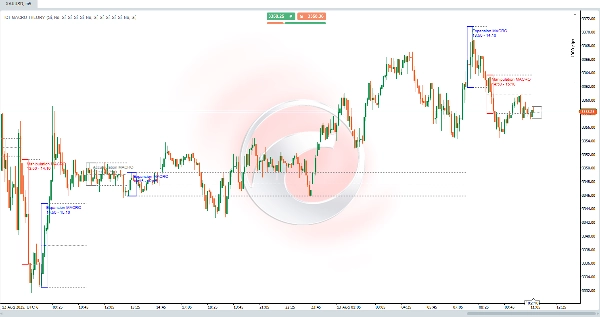
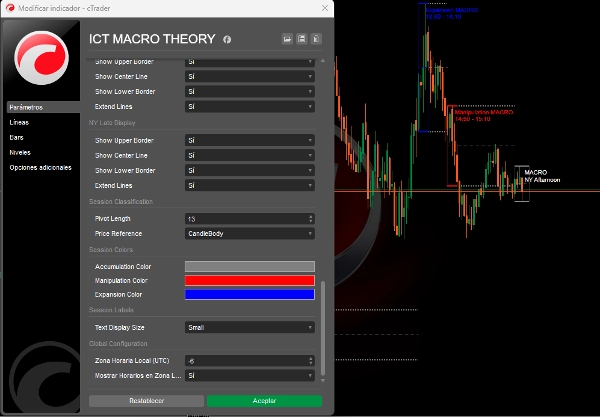
🌐 ICT 매크로 이론
⚠️ 중요 참고사항: 이 지표는 5분 이하의 타임프레임에서만 작동합니다.
ICT 매크로 기간 설명
ICT 매크로 기간은 본질적으로 알고리즘이 유동성을 찾거나 공정 가치 갭을 조정하는 짧은 구간입니다. 이 ICT 매크로의 기초는 ICT의 시간 및 가격 이론에 있습니다.
매크로는 "가격 전달에서 이벤트를 생성하는 짧은 명령어 시리즈"로 ICT 자체에 의해 정의됩니다.
ICT 매크로는 완전한 거래 전략은 아니지만, 거래에 합류 요소를 추가하고 수익을 극대화할 수 있습니다. 런던, 뉴욕, 정오, 오후 세션 동안 발생합니다.
🔮 ICT 매크로 시간 이론의 고급 구현:
ICT 개념과의 직접 연결:
코드는 이론에서 설명된 3가지 유형의 ICT 매크로를 정확히 구현하며, 다음을 기반으로 분류 논리를 사용합니다:
- 시장 구조 분석:
-
- 매크로 세션 감지
- 정확한 ICT 시간 기록 (런던 02:33, 뉴욕 09:50 등).
- 각 매크로 세션 전후의 구조적 변화 감지.
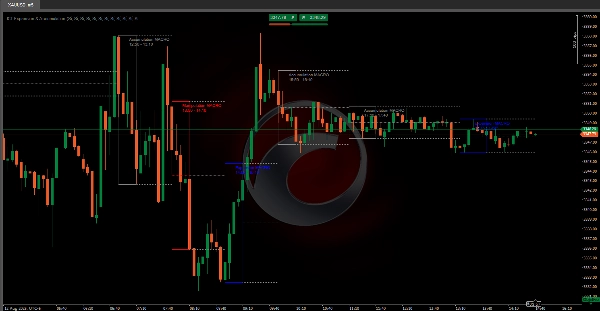
- 자동 분류:
-
- 🟥 조작: 가격이 양쪽(매수/매도)에서 유동성을 쓸어갈 때.
- 🟦 확장: 한쪽에서 유동성을 취하는 방향성 움직임 (추세와 일치).
- 🟩 축적: 가격이 유동성을 "축적"하는 좁은 범위.
- 확장된 주요 레벨:
-
- 각 매크로 세션의 고점/저점 표시.
- 평균 가격(중간점)을 계산하여 다음 세션까지 확장.
- 이 레벨들은 동적 지지/저항 역할을 합니다 (ICT에서 필수!).
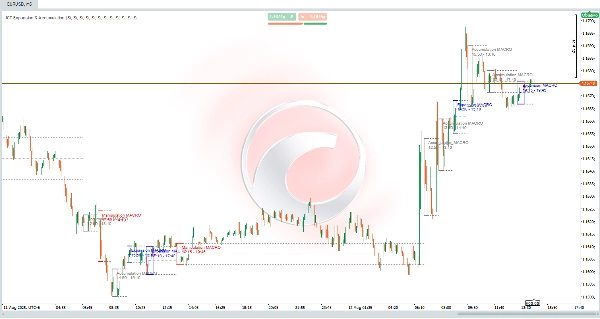
- 실시간 유동성 감지:
-
- 1분 데이터를 사용하여 정확한 피벗 식별 (더 낮은 타임프레임과 동일).
예정된 개선 사항 및 업데이트:
- 유동성 스윕 감지: 이전 유동성 스윕(전일/주간 고점/저점)을 식별할 예정입니다.
- 공정 가치 갭 (FVG): 공정 가치 갭을 감지하고 시각화할 예정입니다.
📊 실용적인 ICT 예시
뉴욕 오프닝 시나리오 (09:50-10:10):
- 세션 전: 가격이 매수 측 유동성(지역 저점)을 쓸어감.
- 세션 중:
-
- 🟥 조작으로 분류됨.
- 가격이 약세 구조로 이동.
- 세션 후:
-
- 확장된 선들이 세션 고점에서 저항을 표시.
- RR 1:3 구역에서 거래 거부.
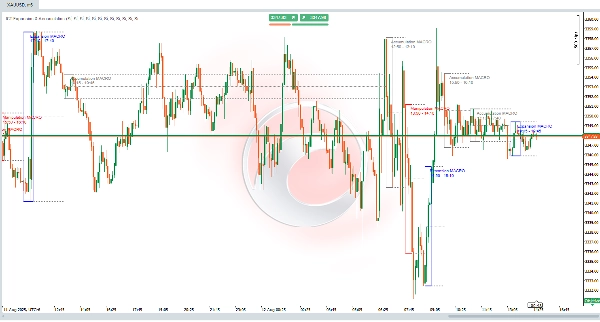
✅ ICT 원칙에 충실함:
"매크로는 완전한 전략은 아니지만 알고리즘이 유동성을 찾는 위치를 식별하여 합류를 추가합니다."
요약
The indicator analyzes market structure and detects key macro sessions—London, New York, midday, and afternoon—recording exact ICT times. It classifies price behavior into three types of macros: Manipulation (price sweeps liquidity on both sides), Expansion (directional movement aligned with trend), and Accumulation (tight range where price accumulates liquidity). It also draws and extends session highs, lows, and average price levels to act as dynamic support and resistance.
Using 1-minute data, ICT MACRO THEORY detects precise pivots for real-time liquidity identification. While not a complete trading strategy, it adds confluence to trades by highlighting where algorithms seek liquidity. Planned updates include detection of liquidity sweeps and visualization of fair value gaps.
This tool is intended for traders seeking to incorporate ICT macro time concepts into their analysis for enhanced market structure insight and liquidity detection on very short timeframes.


!["[Stellar Strategies] Smart ADX" 로고](https://cdn.ctrader.com/image/webp/af13b084-b6f6-41db-b7bc-c7e688b57b05_36929)


