
Descripción
▁▂▃▄▅▆▇ █ 10,000+ traders (institutional + retail) █ ▇▆▅▄▃▂▁
- Elige nuestros indicadores TOP en cTrader 🏆
- ✨ Precisión exclusiva para resultados superiores ✨
- 📈 Nuestros algoritmos —con los visuales mejor valorados 🎯—
- han sido implementados con éxito en 2 fondos cuantitativos
▁▂▃▄▅▆▇ █████████████████████████████ ▇▆▅▄▃▂▁
_______________________________________________
_______________________________________________
📌 Indicadores de Estructura de Mercado
· ✅ AdvancedMarket Structure: Bos, Choch, SwinLevels, Order Blocks, Market Structure& Liquidity Finder
· 🔄 Dynamic Market StructureAnalysis of Turning Points
· 🧱 Order Block
· ⚖️ Market Imbalance
· ⛓️ BOS & CHOCH
· 🧠 ICT Power of 3
______________________________________________________________-
Almacenar cBots : 🧠 Gold & BTC BreakoutSession Pivots 🧠
_______________________________________________
🔚 Sistemas de Salida Inteligente
· 📍 Algoritmo Inteligente de Seguimiento
_______________________________________________
📐 Indicadores ZigZag
· 🔍 Proyección de Liquidez de Precio ZigZag
· ➖ ZigZag
· 🎯 Rastreador de Extremos Zig-Zag
_______________________________________________
🧱 Indicadores de Soporte y Resistencia
· 🟩 Líneas de Soporte y Resistencia SmartTrend
· 🧱 Todos los Niveles de Soporte y Resistencia
_______________________________________________
📊 Indicadores de Tendencia y Canal
· 🔄 Canal de Tendencia Automático
· 📊 Supertrend
· ⚡Analizador de Tendencia Momentum
· 🧠 Canal de Tendencia Adaptativo
· 💥 Sistema de Ruptura de Canal
· 🌈 Gradiente Dinámico de Tendencia
_______________________________________________
💧 Herramientas de Volumen y Liquidez
· 🔥 Mapa de Calor POC de Volumen
· 📉 Mapa de Liquidación de Apalancamiento
· 🔍 Brecha de Valor Justo Momentum
· 🕒 Sesiones de Brecha de Valor Justo
_______________________________________________
⚡ Indicadores de Momentum y RSI
· 📈 Disparador de Tendencia RSI
· 🚀 Momentum de Rango Dinámico
· 🔎 Rastreador de Sesgo de Vela Multi-Nivel
_______________________________________________
🔮 Herramientas de Predicción y Proyección
· 📐 Predicción Basada en Linreg& ATR
· 📏 Regresión Lineal FibonacciMulti-temporal
· 📈 Proyector de Flujo de Mercado Potenciado por Volumen
______________________________________________________________________________________________________
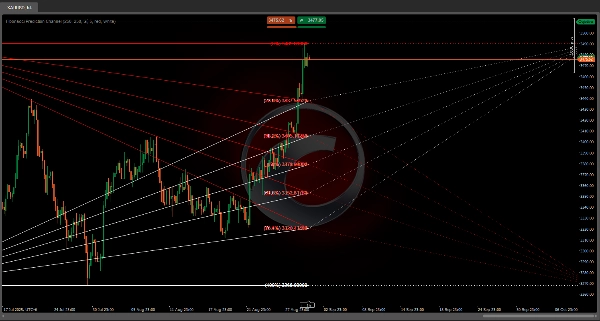
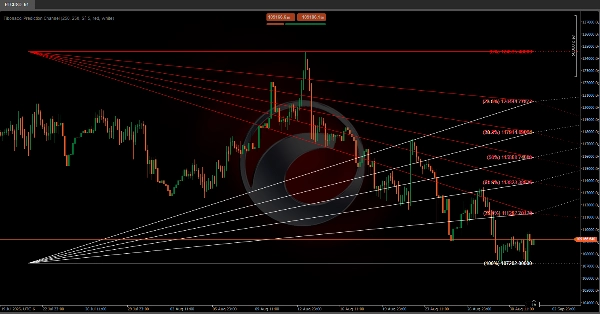
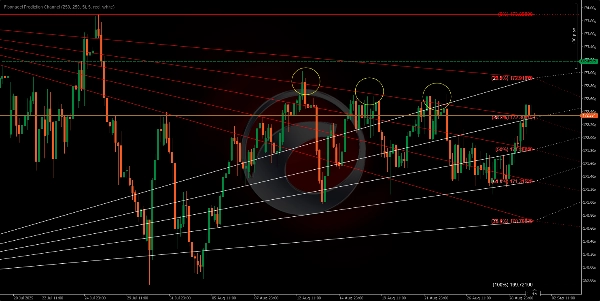
Este algoritmo está diseñado para trazar un canal de predicción futura basado en Fibonacci niveles de retroceso 📊✨. Las líneas de Fibonacci crean una serie de canales paralelos entre cada par de niveles consecutivos. Estos canales pueden interpretarse como rangos dentro de los cuales se espera que el precio fluctúe 📈📉, generando un cono visual donde el precio interactuará 🎯. Si se rompe un nivel ⚡, pasaremos al siguiente.
Estos niveles, que proyectamos hacia el futuro, también actúan como soporte y resistencia 🛡️⚔️, creando canales visuales en el gráfico que pueden ayudarnos a anticipar y planificar acciones 🧠✅ basadas en cómo el precio ha reaccionado a estos niveles en el pasado.
Podemos esperar que el precio reaccione al acercarse a estas líneas 🔍, potencialmente rebotando dentro del canal 🔄 o, si hay suficiente momentum 🚀, rompiendo las líneas para pasar al siguiente canal.
Los niveles proyectados hacia la derecha ➡️🗓️ no se basan en nuevos datos de precio sino en la acción pasada del precio ⏳. Se extienden hacia el futuro como una especie de "mapa" 🗺️ para posibles reacciones futuras del precio.
Barras Históricas ⏰: Determina cuántos períodos de precio pasados se considerarán al calcular los niveles de retroceso de Fibonacci.


