
Описание
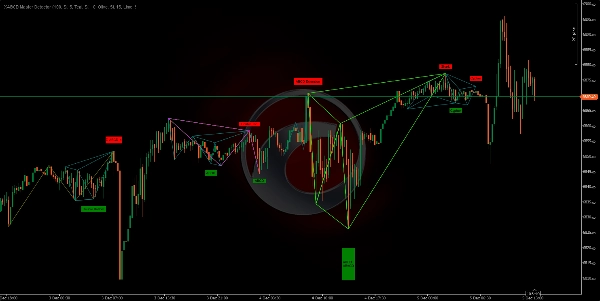
Этот АЛГОРИТМ является продвинутым техническим инструментом 🔧, предназначенным для автоматизации обнаружения геометрических ценовых моделей (гармонических паттернов) и рыночных структур на основе ценового действия. Его основная цель — выявлять зоны потенциального разворота тренда с высокой вероятностью 📍.
https://chartshots.spotware.com/c/693330cd99c57
Что делает этот алгоритм?
Алгоритм сканирует график в реальном времени 🔍 в поисках специфических ценовых формаций. Он работает на двух уровнях:
- Картирование структуры (ZigZag): Сначала он упрощает рыночный шум, рисуя "ZigZag" линии соединяющие важные максимумы и минимумы (пивоты). Используется до 4 различных длины одновременно 📏 для захвата как малых (краткосрочных), так и больших (долгосрочных) трендов.
- Распознавание паттернов: После определения этих пивотных точек (точки A, B, C, D, X) алгоритм измеряет расстояния и соотношения между ними. Если эти соотношения соответствуют математическим правилам классических торговых паттернов (например, Фибоначчи), индикатор рисует паттерн и оповещает пользователя 🚨.
Для чего это нужно?
Это служит для исключения субъективности при построении сложных паттернов и экономии времени на анализ ⏳. Вместо того чтобы вручную измерять каждое коррекционное и расширенное движение Фибоначчи, индикатор делает это автоматически, чтобы:
- Обнаружить развороты: Найти точки, где цена может развернуться (с бычьего на медвежий тренд или наоборот). 🔄
- Определить точки входа: Сигнализировать точные зоны (так называемая "Потенциальная зона разворота") для входа в рынок. 🎯
- Подтвердить анализ: Служить в качестве дополнительного подтверждения вашей собственной стратегии поддержки/сопротивления.
Логика расчетов
Основу индикатора составляют соотношения Фибоначчи и симметрия рынка ⚖️. Алгоритм проверяет строгие правила для каждого паттерна. Например, чтобы подтвердить паттерн "Гартли", алгоритм внутренне вычисляет:
- Является ли коррекция точки B относительно ноги XA точно (или очень близко) равной 0.618.
- Соответствует ли проекция точки D определенным пропорциям.
Индикатор допускает небольшую погрешность (настраиваемую) поскольку рынок редко бывает идеальным до точного пипса. Также он рассчитывает теоретическое соотношение риск/прибыль перед отображением паттерна.
Паттерны, которые он обнаруживает:
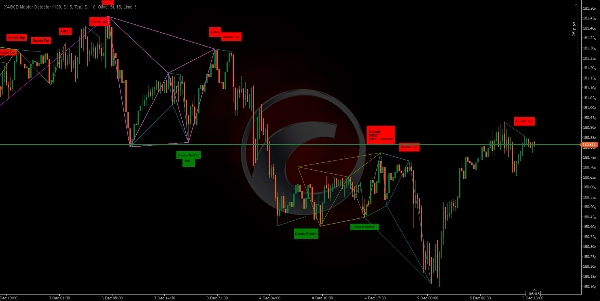
https://chartshots.spotware.com/c/6933314cb9fa1
- Классические: Двойная вершина и двойное дно. 🏔️🏞️
- Гармонические: Гартли, Летучая мышь 🦇, Бабочка 🦋, Краб 🦀, Глубокий краб, Акула 🦈, Сайфер.
- Структуры ABCD: Классический ABCD, AB=CD, Расширенный ABCD.
- Экзотические: Три Драйва, 5-0.
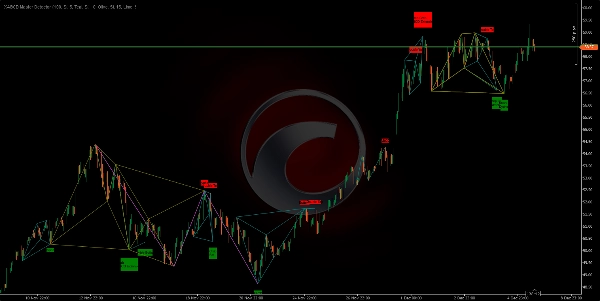
https://chartshots.spotware.com/c/6933317ae4324
Как использовать?
Визуальная настройка:
- Вы увидите цветные линии соединяющие вершины и впадины.
- Когда паттерн завершен, появится цветная геометрическая фигура и метка с названием паттерна (например, "Гартли", "Двойная вершина").
- Зеленые метки: Обозначают бычьи паттерны (ищите покупки). 📈
- Красные метки: Обозначают медвежьи паттерны (ищите продажи). 📉
Интерпретация:
- Не торгуйте каждую метку слепо. Используйте ее как сигнал оповещения.
- Когда появляется паттерн, ждите реакции цены в зоне D (последняя точка паттерна).
- Ищите дополнительное подтверждение (например, японскую свечу разворота или дивергенцию RSI) перед входом.
Ключевые настройки:
- Вы можете включать или отключать конкретные паттерны если хотите торговать только некоторыми (например, только "Летучая мышь" и "Гартли"). ✅
- Вы можете настроить чувствительность ZigZag для отображения более быстрых движений или медленных трендов. ⚙️
🏆 Более 10 000 трейдеров доверяют нашему набору из 25+ алгоритмов! 🏆
От структуры рынка и ликвидности до умных систем выхода и прогнозных инструментов - мы создали ВСЕ необходимые инструменты для стабильной торговли.
👉 Доступ ко всем 25+ проверенным системам:
_______________________________________________
📌 Индикаторы структуры рынка
· ✅ AdvancedMarket Structure: Bos, Choch, SwinLevels, Order Blocks, Market Structure& Liquidity Finder
· 🔄 Dynamic Market StructureAnalysis of Turning Points
· 🧱 Order Block
· ⚖️ Market Imbalance
· ⛓️ BOS & CHOCH
· 🧠 ICT Power of 3
_______________________________________________
🔚 Умные системы выхода
_______________________________________________
📐 Индикаторы ZigZag
· 🔍 ZigZag Price LiquidityProjection
· ➖ ZigZag
_______________________________________________
🧱 Индикаторы поддержки и сопротивления
· 🟩 SmartTrend Support &Resistance Lines
· 🧱 All Support and ResistanceLevels
_______________________________________________
📊 Индикаторы тренда и каналов
· 📊 Supertrend
_______________________________________________
💧 Инструменты объема и ликвидности
_______________________________________________
⚡ Индикаторы импульса и RSI
· 🔎 Multi-Level Candle Bias
Tracker
_______________________________________________
🔮 Инструменты прогнозирования и проекции
· 📐 Прогноз на основе линейной регрессии и ATR
· 📏 Фибоначчи линейная регрессия с мультивременными рамками
· 📈 Проектор рыночного потока на основе объема_________________________
_________________________________________________________________________________________________
_________________________________________________________________________________________________
ТРЕГГЕР КАНАЛА RSI: 📶
Что это такое: Индикатор, который вычисляет RSI(период) и визуально отмечает зоны импульса, когда RSI пересекает уровни перекупленности/перепроданности (по умолчанию 70/30). ✅
https://chartshots.spotware.com/c/69278f8b6d973
Логика: Когда уровень пересекается, создается "зона" на основе максимума/минимума свечи в момент пересечения. Затем: 🧠
- Окрашивает свечи внутри этой зоны.
- Рисует канал (максимум, минимум, середина).
- Отмечает пересечение на панели RSI кружком и меткой.
Зона длится ровно MinZoneDuration баров. ⏱️
Четкие сигналы:
- Пересечение выше уровня перекупленности → инициирует бычью зону. 🟢
- Пересечение ниже уровня перепроданности → инициирует медвежью зону. 🔴
Сама зона является зоной интереса, а не ордером.
https://chartshots.spotware.com/c/69278fb274e0b
Как использовать (быстро):
- Ждите формирования зоны. 🎯
- Подтвердите с помощью ценового действия (пробой/отскок от линий канала).
- Входите с стоп-лоссом за пределами зоны и целью на средней линии канала или заданном соотношении риск/прибыль.
https://chartshots.spotware.com/c/69278fe76237b
Ключевые параметры: ⚙️
- Период RSI (14)
- Перекупленность (70)
- Перепроданность (30)
- MinZoneDuration (15)
- Настраиваемые цвета 🎨
Сводка
The algorithm recognizes classic and complex patterns—including Double Top/Bottom, Gartley, Bat, Butterfly, Crab, Deep Crab, Shark, Cypher, ABCD structures, and exotic patterns like Three Drives and 5-0—by measuring distances and Fibonacci ratios between pivot points. Upon pattern completion, it visually displays colored geometric figures and labels indicating bullish (green) or bearish (red) signals.
Users can customize pattern detection and ZigZag sensitivity to suit their trading preferences. The indicator supports various markets such as Forex, commodities, indices, stocks, and cryptocurrencies, including symbols like EURUSD, GBPUSD, BTCUSD, XAUUSD, NAS100, and USDJPY.
XABCD Master Detector aims to reduce subjectivity and save analysis time by automatically calculating Fibonacci retracements, extensions, and theoretical risk/reward ratios. It serves as an alert tool to detect reversals, identify entry points, and provide additional confluence to existing support/resistance strategies.
Отзывы покупателей
5 | 100 % | |
4 | 0 % | |
3 | 0 % | |
2 | 0 % | |
1 | 0 % |


