
Opis
Aktywacja trendu oparta na MA z trybami wieloczasowymi i projekcją linii trendu.
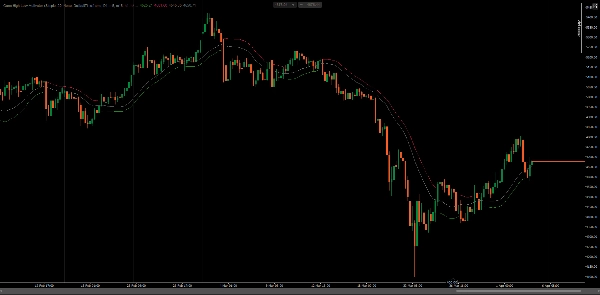
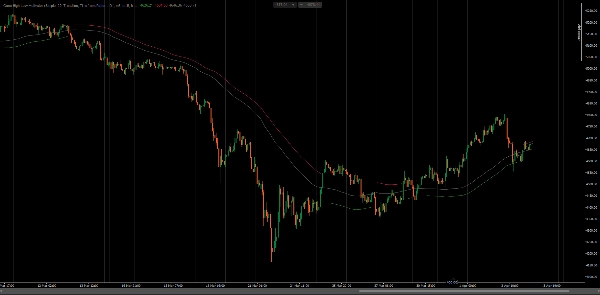
Śledzi kierunek rynku, porównując cenę zamknięcia z średnimi kroczącymi High i Low w konfigurowalnym okresie. Zmienia stan, gdy cena zamknięcia przekracza MA(High) w górę na byczy lub poniżej MA(Low) na niedźwiedzi — rysując przeciwny pas jako aktywny poziom wsparcia lub oporu.
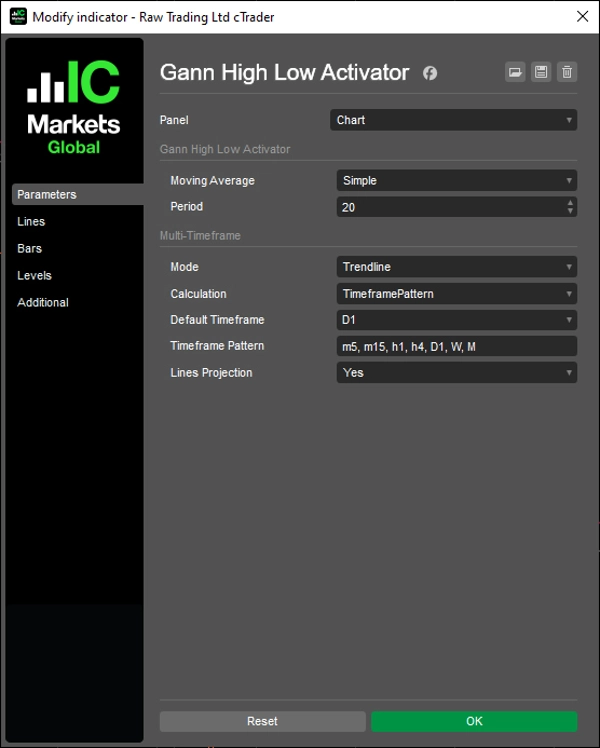
Cztery tryby obliczeń (Brak, Interpolowany, Skalowany Okres, Linia Trendu), wyjścia MA dla otwarcia i zamknięcia, rozdzielczość wzoru ram czasowych dla automatycznego wyboru HTF oraz projekcja linii trendu do estymacji następnego słupka tworzą kompletny system podążania za trendem dla traderów pracujących na wielu ramach czasowych i stylach analizy.
CECHY
Podstawowa logika aktywacji
- Stan byczy: wyzwalany, gdy cena zamknięcia przekracza MA(High) w górę — rysuje MA(Low) jako dynamiczne wsparcie
- Stan niedźwiedzi: wyzwalany, gdy cena zamknięcia przekracza MA(Low) w dół — rysuje MA(High) jako dynamiczny opór
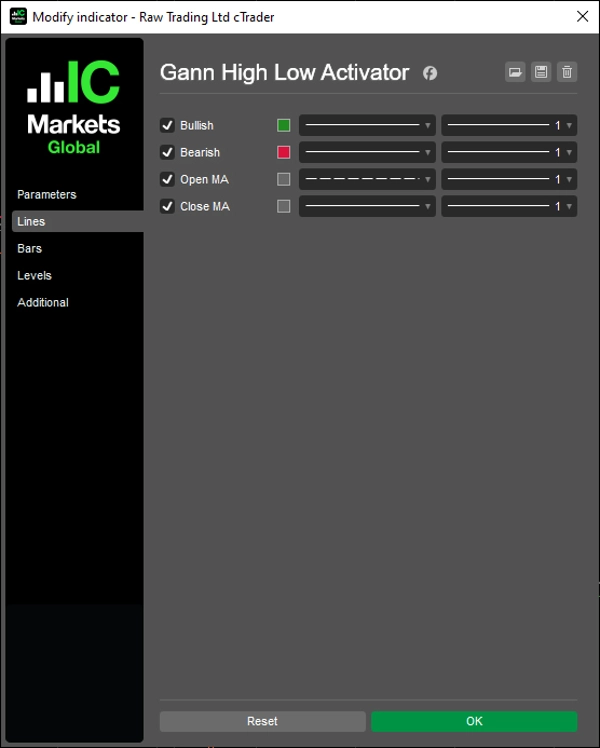
- Wyjścia Open MA i Close MA dla dodatkowej analizy konfluencji i nakładania
- Obsługuje wszystkie typy średnich kroczących cTrader (SMA, EMA, DEMA, TEMA, WMA itp.)
Tryby wieloczasowe
- Brak: standardowe obliczenie na pojedynczej ramie czasowej na aktualnym wykresie
- Interpolowany: wygładzone wartości HTF liniowo mapowane na słupki LTF dla ciągłego nakładania
- Skalowany Okres: skaluje okres według stosunku HTF do LTF — bez potrzeby dodatkowych serii danych
- Linia Trendu: rysuje obiekty linii trendu między granicami słupków HTF z pełną kontrolą stylu
Rozdzielczość ram czasowych
- DefaultTimeframe: ręczny wybór dowolnego HTF z listy rozwijanej parametrów
- TimeframePattern: automatycznie wybiera najbliższą wyższą ramę czasową z listy tokenów oddzielonych przecinkami (np.
m5, m15, h1, h4, D1, W, M) - Tokeny wzoru obsługują minuty (m1–m45), godziny (h1–h12), dni (d1–d3), tygodniowe (W) i miesięczne (M)
Dodatki trybu linii trendu
- Niezależna kontrola koloru, grubości i stylu dla każdej linii wyjściowej
- Przełącznik widoczności automatycznie przebudowuje wszystkie segmenty — brak przestarzałych obiektów
- Segment projekcji wydłuża ostatni segment HTF o jeden słupek do przodu dla przewidywania
Pełna personalizacja
- Konfigurowalny typ i okres MA
- Styl linii dziedziczony przez obiekty linii trendu w trybie Linia Trendu
- Czyste przejście do aktualnej ramy czasowej, gdy HTF ≤ ramie wykresu
- Kontrola długości linii dla zarządzania zakresem wyświetlania
- Panel UI na wykresie do regulacji parametrów w czasie rzeczywistym bez otwierania ustawień
Długość linii
- Kontroluje, jak daleko wstecz linie są wyświetlane — od Hour8 do Year10
Dotyczy wszystkich trybów: wyjścia serii i obiekty linii trendu
Kontrolki UI
- Panel combobox na wykresie dla szybkiego dostępu do typu MA, trybu MTF, obliczeń, ram czasowych i długości linii
- Konfigurowalna pozycja: TopLeft, TopRight, BottomLeft, BottomRight lub ukryty (Brak)
__________________________________________________________________________________________
WIĘCEJ DARMOWYCH WSKAŹNIKÓW
Odkryj szeroki zakres narzędzi analizy rynku — od struktury i wolumenu po regresję, zmienność i niestandardowe ramy czasowe.
Kod źródłowy jest dostępny na GitHub repozytorium.
Wszystko darmowe do użytku. Ale jeśli chcesz wesprzeć kawą, możesz to zrobić tutaj.
Wsparcie/Oporność
Wolumen
- Profiler Aktywności Wolumenu
- Analizator Efektywności Wolumenu
- Analiza Profilu Wolumenu
- Profil Wolumenu - Zaktualizowany
- Analiza Rozproszenia Wolumenu
- VWAP (Wolumenowo Ważona Średnia Cena)
Średnie Kroczące
- Kanał SSL
- Zakotwiczona Średnia Krocząca
- Średnia Krocząca Skalowana Odchyleniem
- Aktywator Ganna High Low
- Natychmiastowa Linia Trendu
- Adaptacyjna MA Kaufmana z Trend Vision
- Kanał Średniej Kroczącej
- Pakiet Średnich Kroczących
- Średnia Krocząca Kanału Trendu
Narzędzia/niestandardowe
Oparte na regresji
Zmienność
Oscylatory
__________________________________________________________________________________________
ZASTRZEŻENIE
Trading wiąże się z ryzykiem. Ten wskaźnik jest przeznaczony wyłącznie do analizy technicznej — zawsze stosuj odpowiednie zarządzanie ryzykiem i handluj odpowiedzialnie.
OPINIE I ULEPSZENIA
Jeśli masz sugestie, prośby o funkcje lub pomysły na ulepszenia, zostaw komentarz na karcie Dyskusja. Twoja opinia pomaga ulepszyć wskaźnik dla wszystkich.
Podsumowanie
Key features include four multi-timeframe calculation modes—None (single timeframe), Interpolated (smoothed higher timeframe values), ScaledPeriod (period scaled by timeframe ratio), and Trendline (trendline objects between higher timeframe bars with style control). It supports all cTrader MA types (SMA, EMA, DEMA, TEMA, WMA, etc.) and offers Open and Close MA outputs for additional analysis.
Timeframe resolution options allow manual or automatic selection of higher timeframes based on customizable token patterns. Trendline mode provides independent styling and projects the trendline forward by one bar for anticipation. The indicator includes extensive customization for MA type, period, line styles, display length, and an on-chart UI panel for runtime parameter adjustments. It is suitable for traders applying trend-following techniques across multiple symbols and timeframes.


![Logo „[CB] Pivot Points Pro”](https://cdn.ctrader.com/image/webp/43463c82-67b0-4f10-a4ba-901bba091d81_32594)


