
คำอธิบาย
▁▂▃▄▅▆▇ █ เทรดเดอร์ 10,000+ ราย (สถาบัน + รายย่อย) █ ▇▆▅▄▃▂▁
- เลือกตัวชี้วัด TOP ของเราใน cTrader 🏆
- ✨ ความแม่นยำพิเศษสำหรับผลลัพธ์ที่เหนือกว่า ✨
- 📈 อัลกอริทึมของเรา — พร้อมภาพที่ได้รับการจัดอันดับสูงสุด 🎯—
- ได้ถูกนำไปใช้สำเร็จในกองทุนควอนท์ 2 แห่ง
▁▂▃▄▅▆▇ █████████████████████████████ ▇▆▅▄▃▂▁
_______________________________________________
_______________________________________________
📌 ตัวชี้วัดโครงสร้างตลาด
· ✅ AdvancedMarket Structure: Bos, Choch, SwinLevels, Order Blocks, Market Structure& Liquidity Finder
· 🔄 Dynamic Market StructureAnalysis of Turning Points
· 🧱 Order Block
· ⚖️ Market Imbalance
· ⛓️ BOS & CHOCH
· 🧠 ICT Power of 3
______________________________________________________________-
เก็บ cBots : 🧠 Gold & BTC BreakoutSession Pivots 🧠
_______________________________________________
🔚 ระบบออกอัจฉริยะ
_______________________________________________
📐 ตัวชี้วัด ZigZag
· 🔍 ZigZag Price LiquidityProjection
· ➖ ZigZag
_______________________________________________
🧱 ตัวชี้วัดแนวรับและแนวต้าน
· 🟩 SmartTrend Support &Resistance Lines
· 🧱 All Support and ResistanceLevels
_______________________________________________
📊 ตัวชี้วัดแนวโน้มและช่องทาง
· 📊 Supertrend
_______________________________________________
💧 เครื่องมือปริมาณและสภาพคล่อง
_______________________________________________
⚡ ตัวชี้วัดโมเมนตัมและ RSI
· 🔎 Multi-Level Candle BiasTracker
_______________________________________________
🔮 เครื่องมือทำนายและคาดการณ์
· 📐 Prediction Based on Linreg& ATR
· 📏 Fibonacci Linear RegressionMulti-timeframe
· 📈 Volume-Powered Market Flow Projector
______________________________________________________________________________________________________
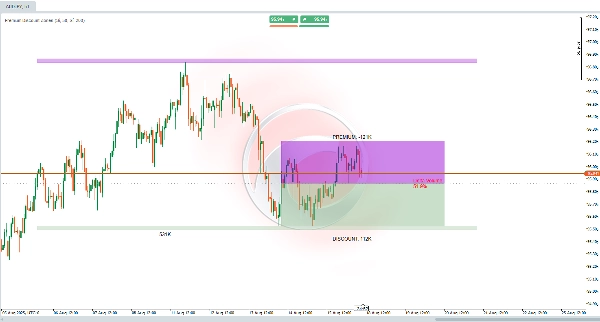
ตัวชี้วัดโซนส่วนลดพรีเมียมทำอะไรได้บ้าง? 🎯
ตัวชี้วัดนี้ถูกออกแบบมาเพื่อช่วยคุณระบุ พื้นที่สำคัญ โดยอิงจากจุดสูงสุดและต่ำสุดของตลาดล่าสุด มันวิเคราะห์ ช่วงเวลาที่กำหนดได้ ของแท่งเทียนที่ผ่านมาเพื่อกำหนดช่วงราคาทั่วไป คำนวณ จุดสมดุลกึ่งกลาง และแบ่งช่วงนั้นออกเป็นสองโซนหลัก:
- 🔺 พรีเมียม (โซนบน)
- 🟩 ส่วนลด (โซนล่าง)
นอกจากนี้ยังประเมินปริมาณการซื้อขายในแท่งเทียนเหล่านั้นเพื่อคำนวณ "Volume Delta" ซึ่งแสดงถึงเปอร์เซ็นต์ของปริมาณที่เกี่ยวข้องกับการเคลื่อนไหวแบบหมี
ใช้ทำอะไร? 💡
ตัวชี้วัดนี้ช่วยให้คุณเห็นพื้นที่ที่ราคาน่าจะเป็น:
- 📈 ราคาสูงเกินไป (โซนพรีเมียม) → โอกาสสำหรับ การขายหรือทำกำไร
- 📉 ราคาต่ำเกินไป (โซนส่วนลด) → โอกาสสำหรับ การซื้อหรือสะสม
มันให้มุมมองอย่างรวดเร็วเกี่ยวกับ ความไม่สมดุลของตลาด โดยเน้นว่าปริมาณล่าสุดสนับสนุนการเคลื่อนไหวแบบกระทิงหรือแบบหมี โซนโครงสร้างที่ขยายออกไป ช่วยคาดการณ์ระดับสำคัญเกินช่วงทันที เหมาะสำหรับการวางแผนการเทรดในแนวโน้มหรือการกลับตัว 🚀
เหมาะสำหรับกลยุทธ์ที่มุ่งเน้น ช่วงการรวมตัว, การเบรคเอาท์, การเทรดสถาบัน หรือการวิเคราะห์สภาพคล่อง!
ตีความอย่างไร? 🔍
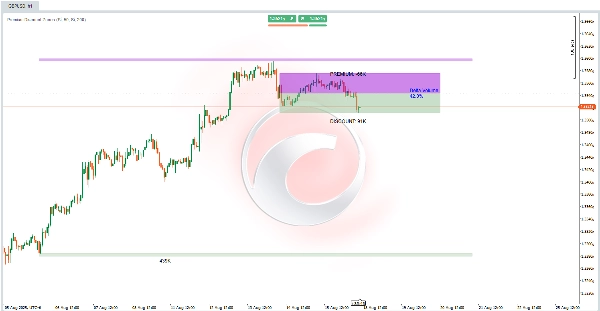
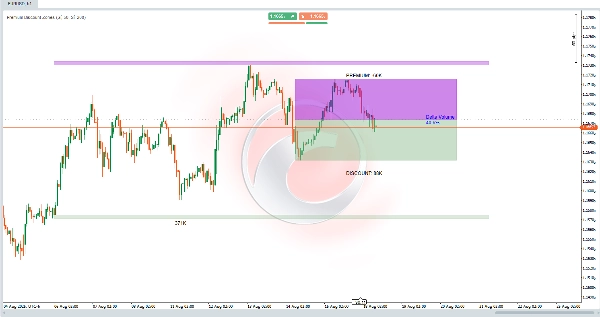
- 🟣 โซนพรีเมียม (สีม่วง เหนือสมดุล) → ช่วงบน ที่ราคาถือว่า "แพง"
- 🟢 โซนส่วนลด (สีเขียว ต่ำกว่าสมดุล) → ช่วงล่าง ที่ราคาถือว่า "ถูก"
- ⚖️ เส้นสมดุล (สีเทา กลาง) → แสดงจุดกึ่งกลางของช่วง ทำหน้าที่เป็นระดับสมดุล การตัดผ่านราคาที่นี่อาจบ่งชี้ถึง การเปลี่ยนแปลงทิศทาง
- 📊 Volume Delta (ตรงกลาง) → แสดง เปอร์เซ็นต์ปริมาณขาย (🔴 >50% = หมี, 🔵 <50% = กระทิง)
- 🏛 โซนโครงสร้าง (ส่วนขยายที่มีเงา) → พื้นที่ขยายเหนือ/ใต้ขอบเขตช่วง ทำหน้าที่เป็น แนวรับ/แนวต้านระยะยาว พร้อมบัฟเฟอร์ตามการเคลื่อนไหวราคาล่าสุด
ตัวชี้วัด อัปเดตโซนเหล่านี้อย่างไดนามิก บนแท่งเทียนล่าสุด โดยขยายไปทางขวาสำหรับการคาดการณ์ในอนาคต
ใช้งานอย่างไรในการเทรด? 🛠️
- การตั้งค่าเริ่มต้น:
-
- เปิดใช้งาน ระดับ PD (หลัก) และ โซนโครงสร้าง ถ้าต้องการ
- ปรับ ช่วงเวลาย้อนหลัง:
-
- สั้น (เช่น 50 แท่ง) → ช่วงล่าสุด
- ยาว (เช่น 200 แท่ง) → บริบทโครงสร้าง
- วิเคราะห์กราฟ (เช่น กรอบเวลา H1):
-
- ตรวจสอบว่าราคาอยู่ใน 🟣 พรีเมียม (พิจารณาขายพร้อมยืนยันแบบหมี) หรือ 🟢 ส่วนลด (พิจารณาซื้อพร้อมยืนยันแบบกระทิง)
- ใช้ Volume Delta เพื่อยืนยัน:
-
- 🔴 >50% → สนับสนุน การเปิดสั้นในโซนพรีเมียม
- 🔵 <50% → สนับสนุน การเปิดยาวในโซนส่วนลด
- กลยุทธ์เข้าและออก:
-
- 🟢 ซื้อในโซนส่วนลด: ถ้าราคาเข้าสู่โซนสีเขียวและเดลต้าอยู่ในระดับต่ำ ให้มองหาการ เปิดสถานะยาว โดยตั้งจุดหยุดใต้จุดต่ำของโซนและตั้งเป้าหมายที่สมดุลหรือพรีเมียม
- 🟣 ขายในโซนพรีเมียม: ถ้าราคาถึงโซนสีม่วงและเดลต้าสูง ให้พิจารณา เปิดสถานะสั้น โดยตั้งจุดหยุดเหนือจุดสูงของโซนและตั้งเป้าหมายที่สมดุลหรือส่วนลด
- 🏛 ใช้โซนโครงสร้าง สำหรับการเทรดระยะยาว โดยใช้บัฟเฟอร์เป็นขอบเขตความผิดพลาด
สรุป
The indicator also computes a Volume Delta, representing the percentage of volume associated with bearish movements, which helps confirm market bias: values above 50% favor bearish conditions, while values below 50% favor bullish conditions. Extended structural zones project key support and resistance levels beyond the immediate range, useful for planning trades in trending or reversal markets.
Users can adjust lookback periods to focus on recent ranges or broader structural context. The indicator dynamically updates these zones and extends them forward for future projections. It supports trading strategies involving consolidation ranges, breakouts, institutional trading, and liquidity analysis by providing visual cues on price valuation and volume-driven market imbalances.


