
Mô tả
🚀 Hơn 10.000 nhà giao dịch đã sử dụng các chỉ báo hàng đầu của chúng tôi 🏆
Khám phá lý do tại sao các chuyên gia chọn chúng tôi – những công cụ mạnh mẽ nhất trên cTrader (chỉ báo, thuật toán và cBots) đang chờ bạn.
👉 Nhận tất cả các hệ thống hàng đầu của chúng tôi tại đây:
_______________________________________________
📌 Chỉ báo Cấu trúc Thị trường
· ✅ AdvancedMarket Structure: Bos, Choch, SwinLevels, Order Blocks, Market Structure& Liquidity Finder
· 🔄 Phân tích Cấu trúc Thị trường Động của Điểm Quay
· 🧱 Order Block
· ⛓️ BOS & CHOCH
· 🧠 ICT Power of 3
_______________________________________________
🔚 Hệ thống Thoát Thông minh
· 📍 Thuật toán Thông minh Theo Sau
_______________________________________________
📐 Chỉ báo ZigZag
· 🔍 Dự báo Thanh khoản Giá ZigZag
· ➖ ZigZag
· 🎯 Bộ Theo dõi Cực điểm Zig-Zag
_______________________________________________
🧱 Chỉ báo Hỗ trợ & Kháng cự
· 🟩 Đường Hỗ trợ & Kháng cự SmartTrend
· 🧱 Tất cả các Mức Hỗ trợ và Kháng cự
_______________________________________________
📊 Chỉ báo Xu hướng & Kênh
· 📊 Supertrend
· ⚡Bộ Phân tích Xu hướng Động lực
· ⭐ KÊNH SSL CAO CẤP
_______________________________________________
💧 Công cụ Khối lượng & Thanh khoản
· 🔥 Bản đồ Nhiệt POC Khối lượng
· 🔍 Khoảng cách Giá Trị Công bằng Động lực
· 🕒 Phiên Khoảng cách Giá Trị Công bằng
_______________________________________________
⚡ Chỉ báo Động lực & RSI
· 🔎 Bộ Theo dõi Định hướng Nến Đa cấp
Tracker
_______________________________________________
🔮 Công cụ Dự đoán & Dự báo
· 📐 Dự đoán dựa trên Linreg& ATR
· 📏 Hồi quy Tuyến tính Fibonacci Đa khung thời gian
· 📈 Máy chiếu Dòng chảy Thị trường dựa trên Khối lượng
______________________________________________________________________________________________
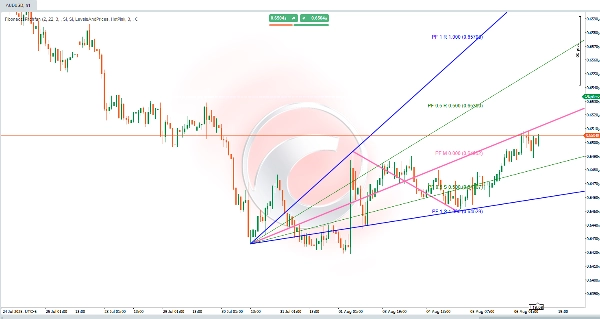
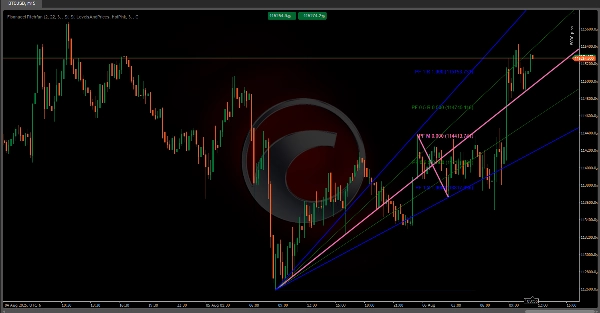
Fibonacci Pitchfan 📊✨
Một chỉ báo kỹ thuật nâng cao kết hợp phát hiện điểm xoay, đường xu hướng động và các mức Fibonacci để tạo ra một công cụ trực quan giúp các nhà giao dịch xác định xu hướng, vùng hỗ trợ/kháng cự và các điểm đảo chiều tiềm năng. 🎯 Có thể tùy chỉnh cao, nó thích ứng với các phong cách giao dịch khác nhau thông qua các tham số cấu hình. Dưới đây là phân tích logic và các phép tính của nó.
Các Thành phần Cốt lõi 🔧
Chỉ báo dựa trên ba yếu tố chính hoạt động cùng nhau:
1. Phát hiện Điểm Xoay 🔄
- Xác định các điểm đảo chiều giá quan trọng (điểm xoay cao/thấp).
- Sử dụng một khoảng thanh do người dùng định nghĩa (độ sâu điểm xoay) để xác định xem một thanh có phải là điểm cao/thấp đáng kể so với các thanh xung quanh hay không.
- Lọc nhiễu bằng cách yêu cầu các điểm xoay vượt qua một ngưỡng lệch dựa trên ATR, đảm bảo chỉ xem xét các biến động giá có liên quan.
2. TrendFan & Các mức Fibonacci 📐
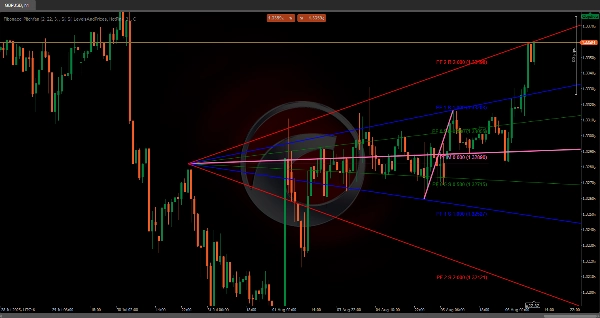
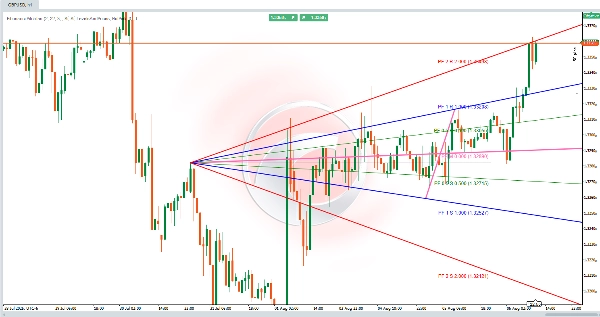
- Chiếu một quạt các đường xu hướng động từ một điểm xoay lịch sử vào tương lai, sử dụng các mức định sẵn (ví dụ: 0.25, 0.5, 1.0) để đánh dấu các vùng hỗ trợ/kháng cự tiềm năng.
- Các mức Fibonacci tùy chọn (đường ngang) làm nổi bật các vùng hồi quy/mở rộng giữa các điểm xoay chính.
Logic Tính Toán 🧮
1. Xác định Điểm Xoay
- Đối với mỗi thanh, thuật toán quét một khoảng đối xứng của các thanh trước/sau (dựa trên độ sâu điểm xoay).
- Một điểm xoay cao được xác nhận nếu giá cao của thanh là cao nhất trong khoảng; một điểm xoay thấp nếu giá thấp của nó là thấp nhất.
- Ngưỡng lệch (một % của ATR so với giá) lọc bỏ các biến động nhỏ, tập trung vào các di chuyển thị trường có ý nghĩa.
2. Tạo TrendFan 🌪️
- Một điểm xoay lịch sử tham chiếu (có thể cấu hình) được ghép với điểm xoay mới nhất để tạo thành một đường cơ sở.
- Một đường trung bình được vẽ giữa chúng, và các đường xu hướng chiếu (ở các mức định sẵn) kéo dài vào tương lai, tạo thành một "quạt" các vùng giá quan trọng.
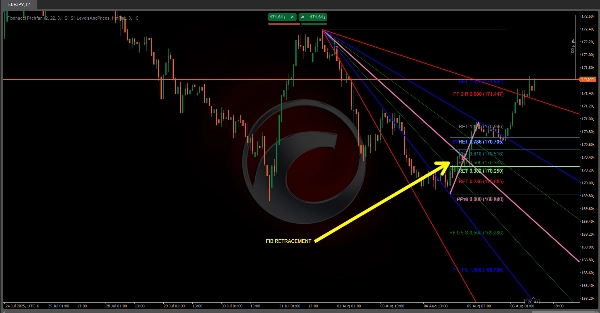
3. Dự báo Fibonacci 🔢
- Các mức hồi quy (ví dụ: 0.236, 0.5, 0.618) đánh dấu các vùng kéo lại tiềm năng trong chuyển động giá trước đó.
- Các mức mở rộng dự báo các mục tiêu giá vượt ra ngoài phạm vi ban đầu, điều chỉnh theo hướng xu hướng.
- Các mức có thể được đảo ngược hoặc mở rộng dựa trên cài đặt của người dùng.
Cài đặt Tùy chỉnh ⚙️
- Ngưỡng Lệch: Điều chỉnh độ nhạy với các biến động giá (dựa trên ATR).
- Độ sâu Điểm Xoay: Xác định phạm vi thanh để phát hiện điểm xoay (ảnh hưởng đến tần suất tín hiệu).
- Tham chiếu Lịch sử: Đặt khoảng cách trở lại để chọn điểm xoay ban đầu cho TrendFan.
- Hiển thị: Bật/tắt hiển thị TrendFan/Fibonacci và chọn các mức cụ thể để hiển thị.
Kết luận 🏆
Fibonacci Pitchfan là một công cụ mạnh mẽ đa năng dành cho các nhà giao dịch tìm kiếm một cái nhìn rõ ràng, động về cấu trúc thị trường. Bằng cách kết hợp điểm xoay, đường xu hướng và các mức Fibonacci, nó cung cấp những hiểu biết có thể hành động để dự đoán biến động giá và đưa ra quyết định thông minh. 🚀
Tóm tắt
It generates a "TrendFan" by projecting dynamic trendlines from a configurable historical pivot to the latest pivot, creating a fan of key price zones. Optional Fibonacci retracement and extension levels highlight potential pullback areas and price targets, which can be customized or inverted according to user preferences.
Key customizable settings include deviation threshold sensitivity, pivot depth (bar range for pivot detection), historical reference for the initial pivot selection, and visibility options for TrendFan and Fibonacci levels. This tool is suitable for traders seeking actionable insights to anticipate price movements and make informed decisions based on a comprehensive view of market dynamics.


