

说明
▁▂▃▄▅▆▇ █ 10,000+ 交易者(机构 + 零售) █ ▇▆▅▄▃▂▁
- 选择我们在 cTrader 中的顶级指标 🏆
- ✨ 独家精准,带来卓越成果 ✨
- 📈 我们的算法 —— 拥有最高评价的视觉效果 🎯——
- 已成功应用于两个量化基金
▁▂▃▄▅▆▇ █████████████████████████████ ▇▆▅▄▃▂▁
_______________________________________________
_______________________________________________
📌 市场结构指标
· ✅ AdvancedMarket Structure: Bos, Choch, SwinLevels, Order Blocks, Market Structure& 流动性发现器
🧠 ICT 宏观理论
· 🔄 动态市场结构转折点分析
· 🧱 订单区块
· ⚖️ 市场失衡
· ⛓️ BOS & CHOCH
· 🧠 ICT 三力
· 🌀 市场极性区
______________________________________________________________-
存储 cBots : 🧠 黄金 & BTC 突破会话枢轴 🧠
_______________________________________________
🔚 智能退出系统
· 📍 智能跟踪算法
_______________________________________________
📐 ZigZag 指标
· 🔍 ZigZag 价格流动性投影
· 🧭 支撑与阻力结构 ZigZag
· ➖ ZigZag
· 🎯 Zig-Zag 极端追踪器
_______________________________________________
🧱 支撑与阻力指标
· 🧱 所有支撑和阻力水平
_______________________________________________
📊 趋势与通道指标
· 🔄 自动趋势通道
· 📊 超级趋势
· ⚡动量趋势分析器
· 🧠 自适应趋势通道
· 💥 通道突破系统
· 🌈 动态趋势渐变
· ⭐ 高级 SSL 通道
· 🔁 反应性移动平均线
_______________________________________________
💧 成交量与流动性工具
· 🔥 成交量 POC 热力图
· 📉 杠杆清算图
· 🔍 动量公平价值缺口
· 🕒 公平价值缺口会话
_______________________________________________
⚡ 动量与 RSI 指标
· 📈 RSI 趋势触发器
· 🚀 动态范围动量
· 🔎 多级蜡烛偏向追踪器
_______________________________________________
🔮 预测与投影工具
· 📐 基于线性回归与 ATR 的预测
· 📏 斐波那契线性回归多时间框架
· 📈 成交量驱动的市场流动投影器
📉 斐波那契扇形
______________________________________________________________________________________________________
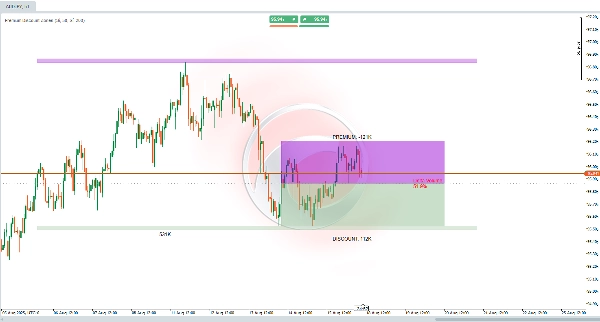
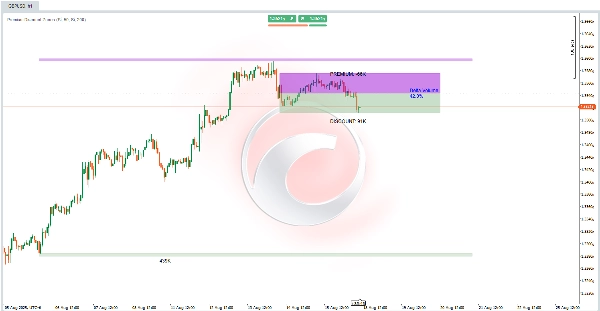
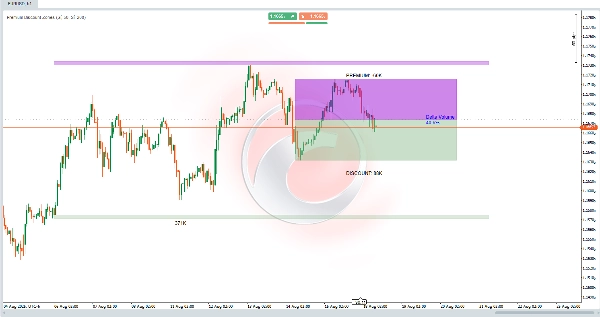
高级折扣区指标的作用是什么? 🎯
该指标旨在帮助您识别基于近期市场高点和低点的关键区域。它分析一个可配置周期的过去柱线以确定一个大致价格范围,计算一个中点均衡,并将该范围划分为两个主要区域:
- 🔺 高级区(上区)
- 🟩 折扣区(下区)
它还评估这些柱线中的交易量以计算一个“成交量差额”,代表与看跌走势相关的成交量百分比。
它的用途是什么? 💡
该指标帮助您发现价格可能处于的区域:
- 📈 高估(高级区) → 可能进行卖出或获利了结
- 📉 低估(折扣区) → 可能进行买入或积累
它提供了对市场失衡的快速观察,突出显示近期成交量是偏向多头还是空头。扩展的结构区将关键水平投射到即时范围之外,有助于规划趋势或反转中的交易。🚀
非常适合针对盘整区间、突破、机构交易或流动性分析的策略!
如何解读? 🔍
- 🟣 高级区(紫色,均衡线以上) → 价格被视为“昂贵”
- 🟢 折扣区(绿色,均衡线以下) → 价格被视为“便宜”
- ⚖️ 均衡线(灰色,中间) → 标记范围中点,作为平衡水平。价格穿越此处可能表示偏向转变
- 📊 成交量差额(中心) → 显示看跌成交量百分比(🔴 >50% = 看跌,🔵 <50% = 看涨)。
- 🏛 结构区(阴影扩展) → 超出范围极值的扩展区域,作为长期支撑/阻力,基于近期价格动作设有缓冲区。
该指标动态更新这些区域,基于近期柱线,向右延伸以进行未来投影。
如何在交易中使用? 🛠️
- 初始设置:
-
- 启用PD 水平(主)和结构区(如需要)。
- 调整回溯周期:
-
- 短期(例如,50 根柱线)→ 最近区间
- 长期(例如,200 根柱线)→ 结构背景
- 图表分析(例如,H1 时间框架):
-
- 检查价格是否处于🟣 高级区(考虑带有看跌确认的卖出)或🟢 折扣区(考虑带有看涨确认的买入)。
- 使用成交量差额进行确认:
-
- 🔴 >50% → 支持高级区的空头
- 🔵 <50% → 支持折扣区的多头
- 进出场策略:
-
- 🟢 折扣区买入:如果价格进入绿色区域且差额较低,寻找多头入场,止损设在区域低点以下,目标设在均衡线或高级区。
- 🟣 高级区卖出:如果价格达到紫色区域且差额较高,考虑空头,止损设在区域高点以上,目标设在均衡线或折扣区。
- 🏛 使用结构区进行长期交易,应用缓冲区作为误差范围。
摘要
The indicator also computes a Volume Delta, representing the percentage of volume associated with bearish movements, which helps confirm market bias: values above 50% favor bearish conditions, while values below 50% favor bullish conditions. Extended structural zones project key support and resistance levels beyond the immediate range, useful for planning trades in trending or reversal markets.
Users can adjust lookback periods to focus on recent ranges or broader structural context. The indicator dynamically updates these zones and extends them forward for future projections. It supports trading strategies involving consolidation ranges, breakouts, institutional trading, and liquidity analysis by providing visual cues on price valuation and volume-driven market imbalances.


