
คำอธิบาย
ตัวบ่งชี้ Pinescriptlabs Store: Pinescriptlabs Store cBots : (cBot) Gold & BTC BreakoutSession Pivots(ใหม่)
Trailing Smart Algorithm (ใหม่)
การทำนายโดยอิงจาก Linreg & ATR
SmartTrend Support &
Resistance
Lines
Dynamic
Market Structure
Analysis
of
Turning
Points
Fibonacci
Linear
Regression
Multi-timeframe
Multi-Level
Candle Bias
Tracker
Auto
Support and
Resistance
Trend
Lines
All
Support and
Resistance
Levels
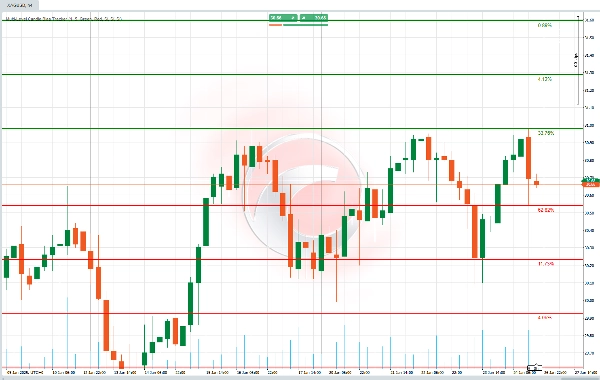
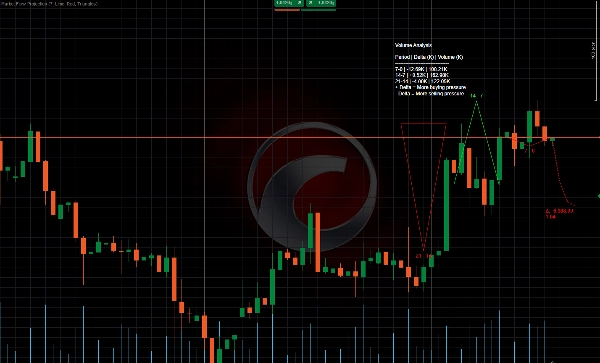
อัลกอริทึมนี้ กำหนดความน่าจะเป็นที่ราคาจะถึงจุดสูงสุดหรือต่ำสุดใหม่ และแสดงเป็นระดับบนแผนภูมิ พร้อมกับเปอร์เซ็นต์ที่เกี่ยวข้อง การคำนวณนี้ได้รับการทดสอบย้อนหลัง และผลลัพธ์จะแสดงในตาราง ทำให้ง่ายต่อการเข้าใจความน่าจะเป็นที่แท่งเทียนถัดไปจะตั้งจุดสูงสุดหรือต่ำสุดใหม่ 📈📉
มันทำงานอย่างไร? 🛠️
- ความน่าจะเป็นของจุดสูงสุดและต่ำสุดใหม่ 🎯
-
- อัลกอริทึมวิเคราะห์พฤติกรรมราคาที่ผ่านมาเพื่อคำนวณความน่าจะเป็นที่ราคาจะทำ จุดสูงสุดหรือต่ำสุดใหม่ ในแท่งเทียนถัดไป
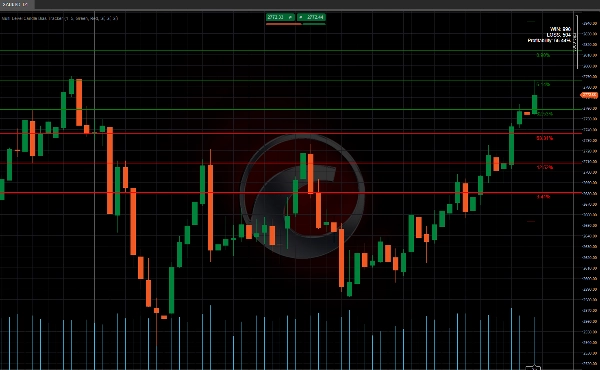
- ตัวอย่างเช่น หากความน่าจะเป็นของจุดสูงสุดใหม่คือ 70% ราคามีแนวโน้มที่จะขึ้นมากกว่า ⬆️
- ระดับพร้อมเปอร์เซ็นต์ 📏
-
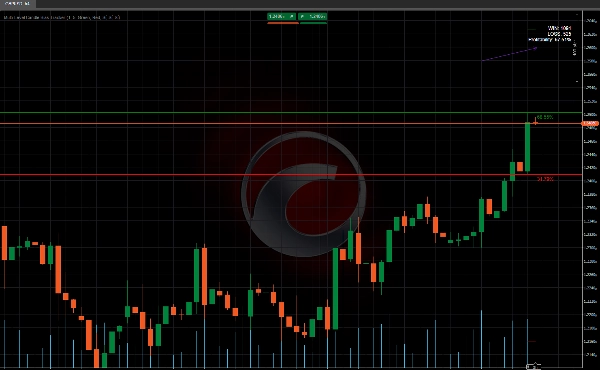
- มันวาดเส้นแนวนอนบนแผนภูมิแทนระดับสำคัญ พร้อมกับเปอร์เซ็นต์ที่แสดงความน่าจะเป็นที่ราคาจะถึงระดับนั้น
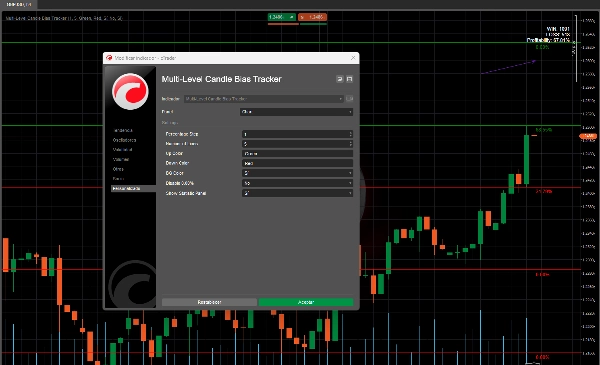
- ระดับเหล่านี้คำนวณโดยใช้ เปอร์เซ็นต์ ที่คุณกำหนด (เช่น 1%)
- แผงสถิติ 📊
-
- มันแสดงจำนวนครั้งที่ราคาถึงระดับเหล่านั้น (ความสำเร็จ) และจำนวนครั้งที่ไม่ถึง
- นอกจากนี้ยังแสดง เปอร์เซ็นต์ความแม่นยำ บอกคุณว่าระดับเหล่านั้นเชื่อถือได้ในอดีตหรือไม่ ✅❌
ใช้ทำอะไร?
- เข้าใจทิศทางราคา: ช่วยให้คุณรู้ว่าราคามีแนวโน้มที่จะขึ้นหรือลงในแท่งเทียนถัดไปมากกว่ากัน ⬆️⬇️
- จัดการความเสี่ยง: หากระดับใดมีความน่าจะเป็นต่ำ คุณสามารถหลีกเลี่ยงเพื่อลดการตัดสินใจที่มีความเสี่ยงได้
จะใช้มันอย่างไร?
- สังเกตระดับต่างๆ: ดูเส้นที่อัลกอริทึมวาดบนแผนภูมิ 👀
- ตรวจสอบความน่าจะเป็น: หากระดับใดมีความน่าจะเป็นสูง (เช่น 70%) ราคามีแนวโน้มที่จะถึงระดับนั้น 📈
- ใช้แผงสถิติ: ตรวจสอบว่าระดับเหล่านั้นเคยทำงานได้ดีในอดีตหรือไม่ เพื่อช่วยตัดสินใจว่าควรเชื่อถือหรือไม่ 📊
สรุป
The indicator includes a statistics panel that shows how many times the price has successfully reached these levels versus how many times it has not, along with an effectiveness percentage reflecting the reliability of these levels based on historical data.
This tool is designed to help traders understand the likely direction of price movement in the next candle and manage risk by avoiding levels with low probabilities. Users apply it by observing the drawn levels, checking their associated probabilities, and reviewing the statistics panel to assess the historical performance of these signals.
Supported markets include commodities, cryptocurrencies (e.g., BTCUSD), and other symbols. The indicator integrates probability-based analysis into price action trading to assist in decision-making regarding potential breakout or trend continuation scenarios.
รีวิวจากลูกค้า
5 | 100 % | |
4 | 0 % | |
3 | 0 % | |
2 | 0 % | |
1 | 0 % |


