
Fear & Greed Index
指标
364 下载
版本 1.0, Jun 2025
Windows 版、Mac 版
5.0
评价:1
说明
Pinescriptlabs 商店指标: Pinescriptlabs 商店 cBots : (cBot) Gold & BTC 突破会话枢轴(新)
追踪智能算法(新)
恐惧与贪婪指数
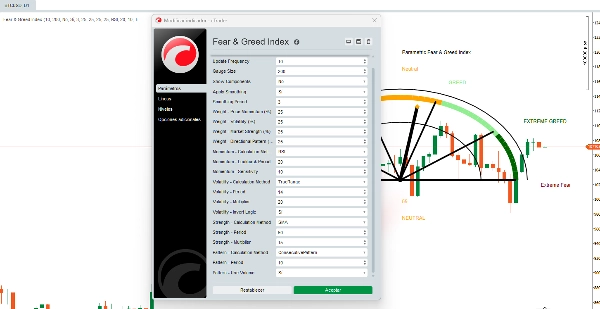
该 恐惧与贪婪 指标是一种先进的视觉算法,将市场情绪综合为一个 0-100 值,使用一个 半圆形仪表。与基础版本不同,该工具 完全可定制,允许交易者调整其计算的每个方面。
📊 四个核心组成部分(可配置)
1️⃣ 价格动量 *(可配置权重:0-100%)*
6 种计算方法可用:
- 价格变化:与前一周期的简单百分比变化
- ROC:归一化变化率
- RSI:修正的动量 RSI
- SMA 偏差:价格偏离简单移动平均线
- EMA 偏差:价格偏离指数移动平均线
- MACD:MACD 信号作为动量指标
🔧 可定制参数:
- 回溯周期 *(5-100)*
- 计算灵敏度 *(1.0-50.0)*
2️⃣ 波动率 *(可配置权重:0-100%)*
6 种计算方法可用:
- 真实范围:基于真实范围的波动率
- 高低范围:简单的高低价范围
- 收盘到收盘:对数收盘到收盘波动率
- ATR:标准平均真实范围
- 标准差:价格标准差
- 帕金森波动率:帕金森波动率估计器
🔧 可定制参数:
- 计算周期 *(5-50)*
- 波动率乘数 *(1.0-100.0)*
- 逻辑反转 (波动率越高=恐惧越强)
3️⃣ 市场强度 *(可配置权重:0-100%)*
6 种计算方法可用:
- SMA:相对于简单移动平均线的位置
- EMA:相对于指数移动平均线的位置
- VWAP:相对于成交量加权平均价的位置
- 高低带:高低价带内的位置
- 布林带位置:布林带内的位置
- 枢轴距离:与枢轴点的距离
🔧 可定制参数:
- 计算周期 *(10-200)*
- 强度乘数 *(1.0-50.0)*
4️⃣ 方向模式 *(可配置权重:0-100%)*
6 种计算方法可用:
- 多空比率:多头/空头蜡烛比例
- 成交量模式:成交量趋势分析
- 实体大小模式:蜡烛实体大小分析
- 影线模式:影线模式分析
- 缺口模式:缺口检测与分析
- 连续模式:连续价格运动分析
🔧 可定制参数:
- 分析周期 *(5-30)*
- 计算中成交量使用 (可选)
⚙️ 高级功能
🔹 灵活的权重系统
- 每个组件的自定义权重 *(0-100%)*
- 如果权重总和不为 100%,则自动归一化
- 对次优配置的警告
🔹 智能平滑
- 可选平滑以减少噪音
- 可调节平滑周期 *(1-10)*
- 对最终结果应用 SMA 滤波器
🔹 完全可定制的显示
- 仪表大小 *(50-500px)*
- 更新频率 *(1-50 根柱)*
- 可选组件细分 (显示单独数值)
- 自动适应工具和时间框架
🔄 算法流程
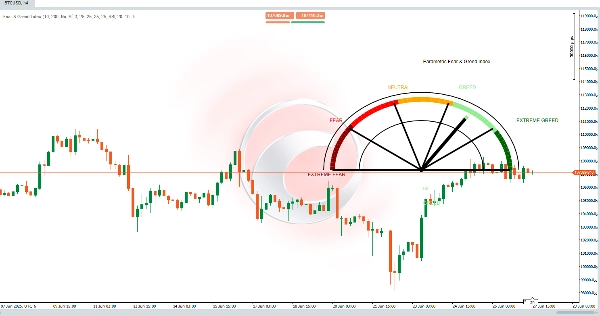
步骤 4:可视化
半圆形仪表显示 5 个颜色区域:
- 0-20:极度恐惧
- 21-40:恐惧
- 41-60:中性
- 61-80:贪婪
- 81-100:极度贪婪
✅ 完全可定制系统:
🎯 完全灵活
- 适应任何市场: 外汇、加密货币、股票、大宗商品
- 特定时间框架:针对 剥头皮与波段交易的不同设置
- 随市场演变:根据条件变化调整策略
摘要
AI 摘要
The Fear & Greed Index indicator is a customizable market sentiment tool that synthesizes multiple data components into a single 0-100 value displayed on a semi-circular gauge. It integrates four configurable core components—Price Momentum, Volatility, Market Strength, and Directional Pattern—each with six selectable calculation methods. Users can adjust weights for each component, with automatic normalization and warnings for suboptimal settings. The indicator supports parameters such as lookback periods, calculation sensitivity, volatility multipliers, and optional volume usage. It features smart smoothing options to reduce noise and a fully customizable display including gauge size, update frequency, and optional component breakdown. The gauge visualizes sentiment across five color-coded zones: Extreme Fear (0-20), Fear (21-40), Neutral (41-60), Greed (61-80), and Extreme Greed (81-100). Designed to adapt to any market—including Forex, Crypto, Stocks, and Commodities—and various timeframes, it allows traders to tailor settings for scalping or swing trading. The system evolves with market conditions, providing a flexible and detailed sentiment analysis tool for diverse trading strategies.
指标配置
客户评价
5.0
评价:1
5 | 100 % | |
4 | 0 % | |
3 | 0 % | |
2 | 0 % | |
1 | 0 % |
讨论
常见问答
BTCUSD
Forex
Signal
Breakout
Indices
Commodities
RSI
Bollinger
Scalping
Supertrend
Crypto
Stocks
XAUUSD
ATR
MACD
VWAP
cTrader Store 提供的所有产品,包括交易机器人、指标和插件,均由第三方开发者提供,仅供信息参考和技术访问之用。cTrader Store 并非经纪商,不提供投资建议、个人推荐或任何未来业绩保证。


!["Smart Money Concepts (SMC) [Iridio Capital]" 标识](https://cdn.ctrader.com/image/webp/28b69fd1-ef54-4bed-9487-07e78e883be4_40934)


!["[Stellar Strategies] Smart ADX" 标识](https://cdn.ctrader.com/image/webp/af13b084-b6f6-41db-b7bc-c7e688b57b05_36929)


价格
注册日期 03/10/2024
163
销售
37.78K
免费安装