
说明
▁▂▃▄▅▆▇ █ 10,000+ 交易者(机构 + 零售) █ ▇▆▅▄▃▂▁
- 选择我们在 cTrader 中的顶级指标 🏆
- ✨ 独家精准,带来卓越成果 ✨
- 📈 我们的算法 — 拥有最高评价的视觉效果 🎯—
- 已成功应用于两个量化基金
▁▂▃▄▅▆▇ █████████████████████████████ ▇▆▅▄▃▂▁
_______________________________________________
_______________________________________________
📌 市场结构指标
· ✅ 高级市场结构:Bos,Choch,SwinLevels,订单区块, 市场结构& 流动性发现器
🧠 ICT 宏观理论
· 🔄 动态市场结构转折点分析
· 🧱 订单区块
· ⚖️ 市场失衡
· ⛓️ BOS & CHOCH
· 🧠 ICT 三力合一
· 🌀 市场极性区域
______________________________________________________________-
商店 cBots : 🧠 黄金 & BTC 突破交易时段枢轴 🧠
_______________________________________________
🔚 智能退出系统
· 📍 跟踪智能算法
_______________________________________________
📐 之字形指标
· 🔍 之字形价格流动性投影
· 🧭 支撑与阻力结构之字形
· ➖ 之字形
· 🎯 之字形极限追踪器
_______________________________________________
🧱 支撑与阻力指标
· 🟩 智能趋势支撑与阻力线
· 🧱 所有支撑与阻力水平
_______________________________________________
📊 趋势与通道指标
· 🔄 自动趋势通道
· 📊 超级趋势
· ⚡动量趋势分析器
· 🧠 自适应趋势通道
· 💥 通道突破系统
· 🌈 动态趋势梯度
· ⭐ 高级 SSL 通道
· 🔁 反应性移动平均线
_______________________________________________
💧 成交量与流动性工具
· 🔥 成交量 POC 热力图
· 📉 杠杆清算图
· 🔍 动量公允价值缺口
· 🕒 公允价值缺口时段
_______________________________________________
⚡ 动量与 RSI 指标
· 📈 RSI 趋势触发器
· 🚀 动态范围动量
· 🔎 多级蜡烛偏向追踪器
_______________________________________________
🔮 预测与投影工具
· 📐 基于线性回归 & ATR 的预测
· 📏 斐波那契线性回归多时间框架
· 📈 成交量驱动的市场流动投影器
📉 斐波那契扇形
______________________________________________________________________________________________________
反转概率引擎 🔄
一种用于检测反转区域的混合指标 + 支撑与阻力“黄金水平”的多维映射。它结合了结构分析(斐波那契窗口高点/低点)、动态(价格速度与加速度)、熵/混沌(有序与无序)、动量和成交量,生成:
- 按时间范围分层的支撑/阻力水平。
- 潜在反转(峰值和谷值)的概率信号及其置信度百分比。⚠️
- 用于交易和止损上下文的活动区域(矩形)。
- 汇聚簇(当多个时间框架在同一价格重合时)。🎯
2. 目标
通过识别以下内容减少视觉噪音并促进决策:
- 价格在不同时间范围内被压缩或锚定的位置。
- 反转的统计概率增加的位置(已确认或预期)。📊
- 具有最大“权重”(汇聚)的水平。
3. 概念逻辑
a) 水平: 对于每个斐波那契窗口,取最近的高点(R)和低点(S);这提供了从超短期到宏观的分形尺度上下文。
b) 融合: 如果多个不同水平落在 X 点内,则将它们分组 → 形成带有合并标签和汇聚计数的簇。
c) 反转信号: 寻找局部耗尽模式(波形)、减速(斜率变化)、低熵下降(低熵 = 更具方向性的运动,易于反转)、可能的内部背离以及动量/成交量验证。
d) 预测模式: 允许在完全确认之前预测反转(钻石),如果相反的加速度 + 低熵 + 极端状态一致。💎
e) 概率: 对各种因素(趋势、混沌、动量、成交量、背离、适应性)进行归一化加权。结果截断在 40–99%。
f) 活动区域: 信号出现后,寻找最合理的范围(相关水平之间)以管理交易并为止损提供上下文。
4. 视觉组件
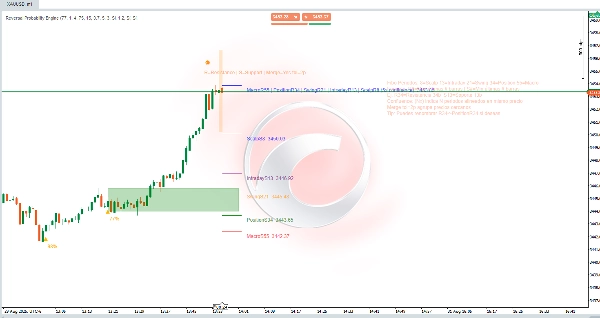
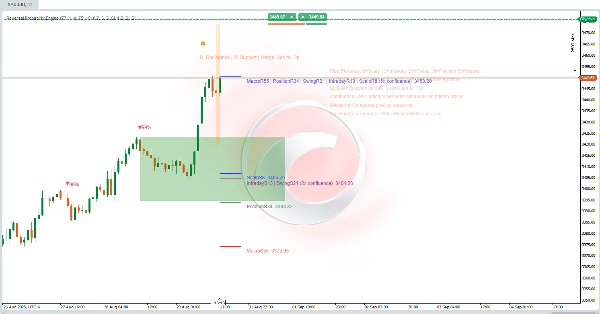
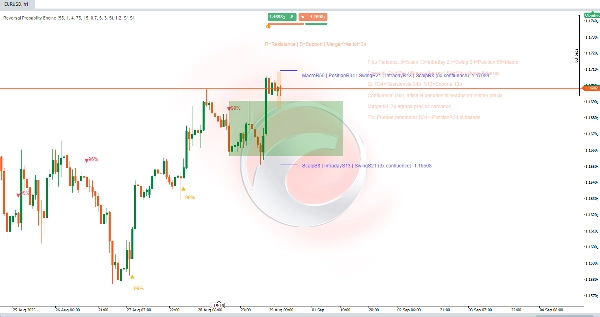
- 水平线: 按周期划分的水平线(Scalp 8,Intraday 13,Swing 21,Position 34,Macro 55)。每个时间范围颜色一致。
- R#/S# 标签: R = 阻力(该窗口的最近高点),S = 支撑(最近低点)。例如:R34 = 来自最近 34 根蜡烛的阻力。
- 合并标签:
ScalpS8 | IntradayS13 | … (5x 汇聚) 价格。表示 N 个不同周期产生相同水平(或在容差范围内)。数量越多,相关性越强。✅ - (Nx 汇聚): 重合周期数量。
- 合并容差=Xp: 以点为单位的容差,用于分组附近水平(避免过度饱和)。
- 概率(%): 三角形(向下/向上)或钻石(早期检测)上方/下方的文本。
- 绿色矩形(活动区域): 信号后评估演变的动态操作通道。
- 额外细微块/颜色: 如果激活,显示支撑元素(波浪/粒子)。
5. 实际解读
- 高汇聚(≥3x)= 强力“磁铁”或枢轴水平;注意价格反应。🧲
- 信号 + 附近汇聚 增强有效性(但不保证)。
- 概率 ≥ 最小置信度 %: 考虑操作的最低过滤条件。
- 区分预期(钻石) 与 确认(三角形): 预期提供更好的风险/回报,更高的误报率;确认信号则不对称性较小,但验证更多。
- 矩形: 如果价格保持在内部且未否定相反边缘,假设仍然有效;干净突破则降低预期。
- 扩大或缩小合并容差: 较小 = 更高粒度,较大 = 更综合的簇。
6. 使用流程
- 在所需的工具和时间框架上加载指标。
- 根据容忍度调整最小置信度百分比(例如,剥头皮时较低,波段时较高)。
- 检查是否出现多个支撑/阻力簇(5x,4x 等)。
- 等待信号(理想情况下出现在簇边缘且概率高)。🔔
- 在活动区域内限定管理:分批入场或确认失败突破。
- 设定合理止损:超出第一个未包含在汇聚中的较低(多头)或较高(空头)水平。
- 停用不使用的周期(例如,仅使用波段/宏观进行多头仓位)。
- 调整容差,并可选择在熟悉后隐藏说明面板。
7. 快速标签阅读示例
ScalpS8 | IntradayS13 | SwingS21 | PositionS34 | MacroS55 (5x 汇聚)
含义: 所有时间框架(8–55)共享同一支撑 → 多尺度结构支撑。反应概率更高;如果伴随成交量失守,则意味着更严重的体制变化。🚨
摘要
Key features include:
- Hierarchical support and resistance levels categorized by time horizons (from ultra-short scalp to macro scales).
- Probabilistic reversal signals indicating potential peaks and valleys with confidence percentages.
- Active zones displayed as rectangles to help contextualize trade entries and stop placements.
- Confluence clusters that highlight price levels confirmed across multiple timeframes, enhancing level significance.
The indicator reduces visual noise by grouping nearby levels within a tolerance range and provides clear visual components such as horizontal lines, labeled resistance/support points, merged confluence labels, probability percentages, and active zones. It distinguishes between anticipated and confirmed reversal signals, offering traders options for risk management and trade timing.
Users can adjust confidence thresholds and merge tolerances to tailor granularity and filtering according to their trading style and timeframe. The tool supports structured decision-making by identifying statistically significant reversal areas and multi-scale support/resistance clusters on any instrument and timeframe.
客户评价
5 | 0 % | |
4 | 0 % | |
3 | 0 % | |
2 | 0 % | |
1 | 100 % |


