Descripción
🚀 Más de 10,000 traders ya usan nuestros PRINCIPALES indicadores🏆
Descubre por qué los profesionales nos eligen: las herramientas más potentes en cTrader (indicadores, algoritmos y cBots) te están esperando.
👉 Obtén todos nuestros sistemas TOP aquí:
_______________________________________________
📌 Indicadores de Estructura de Mercado
· ✅ AdvancedMarket Structure: Bos, Choch, SwinLevels, Order Blocks, Market Structure& Liquidity Finder
· 🔄 Análisis Dinámico de Estructura de Mercado de Puntos de Giro
· 🧱 Bloque de Orden
· ⛓️ BOS & CHOCH
· 🧠 ICT Poder de 3
· 🌀 Zonas de Polaridad de Mercado
_______________________________________________
🔚 Sistemas de Salida Inteligente
· 📍 Algoritmo Inteligente de Seguimiento
_______________________________________________
📐 Indicadores ZigZag
· 🔍 Proyección de Liquidez de Precio ZigZag
· ➖ ZigZag
· 🎯 Rastreador de Extremos Zig-Zag
_______________________________________________
🧱 Indicadores de Soporte y Resistencia
· 🟩 Líneas de Soporte y Resistencia SmartTrend
· 🧱 Todos los Niveles de Soporte y Resistencia
_______________________________________________
📊 Indicadores de Tendencia y Canal
· 🔄 Canal de Tendencia Automático
· 📊 Supertrend
· ⚡Analizador de Tendencia Momentum
· 🧠 Canal de Tendencia Adaptativo
· 💥 Sistema de Ruptura de Canal
· 🌈 Gradiente Dinámico de Tendencia
_______________________________________________
💧 Herramientas de Volumen y Liquidez
· 🔥 Mapa de Calor POC de Volumen
· 📉 Mapa de Liquidación por Apalancamiento
· 🔍 Brecha de Valor Justo Momentum
· 🕒 Sesiones de Brecha de Valor Justo
_______________________________________________
⚡ Indicadores de Momentum y RSI
· 📈 Disparador de Tendencia RSI
· 🚀 Momentum de Rango Dinámico
· 🔎 Sesgo de Vela Multi-Nivel
Rastreador
_______________________________________________
🔮 Herramientas de Predicción y Proyección
· 📐 Predicción Basada en Linreg& ATR
· 📏 Regresión Lineal Fibonacci Multi-temporal
· 📈 Proyector de Flujo de Mercado Potenciado por Volumen
______________________________________________________________________________________________
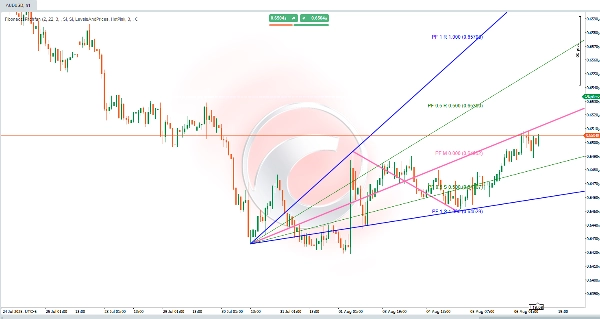
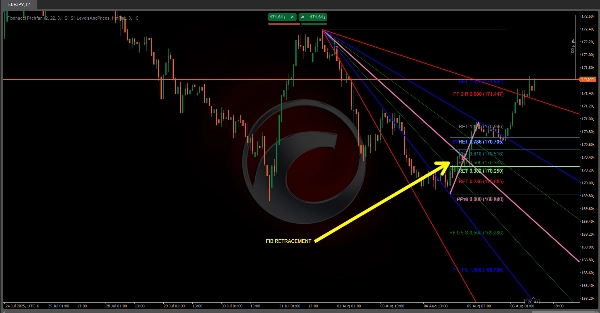
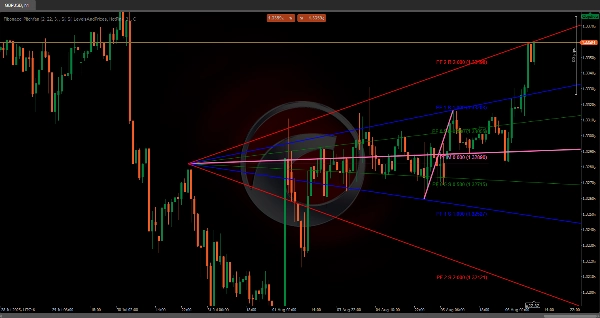
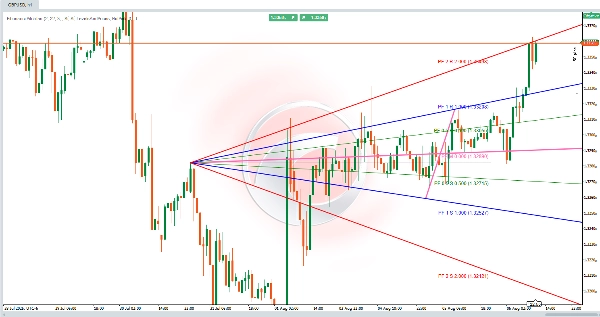
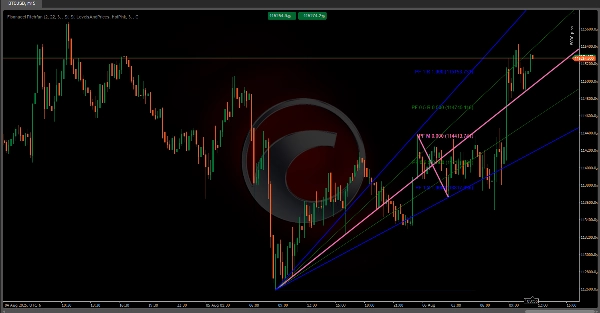
Fibonacci Pitchfan 📊✨
Un indicador técnico avanzado que combina detección de pivotes, líneas de tendencia dinámicas, y niveles de Fibonacci para crear una herramienta visual que ayuda a los traders a identificar tendencias, zonas de soporte/resistencia y posibles puntos de reversión. 🎯 Altamente personalizable, se adapta a diferentes estilos de trading mediante parámetros configurables. A continuación se presenta un desglose de su lógica y cálculos.
Componentes Principales 🔧
El indicador se basa en tres elementos clave que trabajan juntos:
1. Detección de Pivotes 🔄
- Identifica puntos clave de reversión de precio (pivotes altos/bajos).
- Usa un rango de barras definido por el usuario (profundidad del pivote) para determinar si una barra es un alto/bajo significativo frente a las barras circundantes.
- Filtra el ruido requiriendo que los pivotes superen un umbral de desviación basado en ATR, asegurando que solo se consideren oscilaciones de precio relevantes.
2. TrendFan y Niveles de Fibonacci 📐
- Proyecta un abanico de líneas de tendencia dinámicas desde un pivote histórico hacia el futuro, usando niveles predefinidos (p. ej., 0.25, 0.5, 1.0) para marcar posibles soportes/resistencias.
- Niveles opcionales de Fibonacci (líneas horizontales) resaltan retrocesos/extensiones entre pivotes clave.
Lógica de Cálculo 🧮
1. Identificación de Pivotes
- Para cada barra, el algoritmo escanea un rango simétrico de barras anteriores/siguientes (basado en la profundidad del pivote).
- Se confirma un pivote alto si el máximo de la barra es el más alto en el rango; un pivote bajo si su mínimo es el más bajo.
- El umbral de desviación (un % del ATR relativo al precio) filtra fluctuaciones menores, enfocándose en movimientos significativos del mercado.
2. Generación del TrendFan 🌪️
- Un pivote histórico de referencia (configurable) se empareja con el pivote más reciente para formar una línea base.
- Se dibuja una línea media entre ellos, y las líneas de tendencia proyectadas (en niveles predefinidos) se extienden hacia el futuro, creando un "abanico" de zonas clave de precio.
3. Proyecciones de Fibonacci 🔢
- Niveles de retroceso (p. ej., 0.236, 0.5, 0.618) marcan posibles áreas de retroceso dentro del movimiento previo del precio.
- Niveles de extensión proyectan objetivos de precio más allá del rango inicial, ajustados según la dirección de la tendencia.
- Los niveles pueden ser invertidos o extendidos según la configuración del usuario.
Configuraciones Personalizables ⚙️
- Umbral de Desviación: Ajusta la sensibilidad a los movimientos de precio (basado en ATR).
- Profundidad del Pivote: Define el rango de barras para la detección de pivotes (afecta la frecuencia de señales).
- Referencia Histórica: Establece cuán atrás se selecciona el pivote inicial para el TrendFan.
- Visibilidad: Activa o desactiva la visualización del TrendFan/Fibonacci y selecciona niveles específicos para mostrar.
Conclusión 🏆
El Fibonacci Pitchfan es una herramienta poderosa todo en uno para traders que buscan una visión clara y dinámica de la estructura del mercado. Al fusionar pivotes, líneas de tendencia y niveles de Fibonacci, proporciona información accionable para anticipar movimientos de precio y tomar decisiones informadas. 🚀
Resumen
It generates a "TrendFan" by projecting dynamic trendlines from a configurable historical pivot to the latest pivot, creating a fan of key price zones. Optional Fibonacci retracement and extension levels highlight potential pullback areas and price targets, which can be customized or inverted according to user preferences.
Key customizable settings include deviation threshold sensitivity, pivot depth (bar range for pivot detection), historical reference for the initial pivot selection, and visibility options for TrendFan and Fibonacci levels. This tool is suitable for traders seeking actionable insights to anticipate price movements and make informed decisions based on a comprehensive view of market dynamics.