
Descripción
▁▂▃▄▅▆▇ █ 10,000+ traders (institutional + retail) █ ▇▆▅▄▃▂▁
- Elija nuestros mejores indicadores en cTrader 🏆
- ✨ Precisión exclusiva para resultados superiores ✨
- 📈 Nuestros algoritmos —con los visuales mejor valorados 🎯—
- han sido implementados con éxito en 2 fondos cuantitativos
▁▂▃▄▅▆▇ █████████████████████████████ ▇▆▅▄▃▂▁
_______________________________________________
_______________________________________________
📌 Indicadores de Estructura de Mercado
· ✅ AdvancedMarket Structure: Bos, Choch, SwinLevels, Order Blocks, Market Structure& Liquidity Finder
· 🔄 Dynamic Market StructureAnalysis of Turning Points
· 🧱 Order Block
· ⚖️ Market Imbalance
· ⛓️ BOS & CHOCH
· 🧠 ICT Power of 3
______________________________________________________________-
Store cBots : 🧠 Gold & BTC BreakoutSession Pivots 🧠
_______________________________________________
🔚 Sistemas Inteligentes de Salida
· 📍 Algoritmo Inteligente de Seguimiento
_______________________________________________
📐 Indicadores ZigZag
· 🔍 Proyección de Liquidez de Precio ZigZag
· ➖ ZigZag
· 🎯 Rastreador de Extremos Zig-Zag
_______________________________________________
🧱 Indicadores de Soporte y Resistencia
· 🟩 Líneas de Soporte y Resistencia SmartTrend
· 🧱 Todos los Niveles de Soporte y Resistencia
_______________________________________________
📊 Indicadores de Tendencia y Canal
· 🔄 Canal de Tendencia Automático
· 📊 Supertrend
· ⚡Analizador de Tendencia Momentum
· 🧠 Canal de Tendencia Adaptativo
· 💥 Sistema de Ruptura de Canal
· 🌈 Gradiente de Tendencia Dinámico
_______________________________________________
💧 Herramientas de Volumen y Liquidez
· 🔥 Mapa de Calor de Volumen POC
· 📉 Mapa de Liquidación de Apalancamiento
· 🔍 Brecha de Valor Justo Momentum
· 🕒 Sesiones de Brecha de Valor Justo
_______________________________________________
⚡ Indicadores de Momentum y RSI
· 📈 Disparador de Tendencia RSI
· 🚀 Momentum de Rango Dinámico
· 🔎 Rastreador de Sesgo de Vela Multi-Nivel
_______________________________________________
🔮 Herramientas de Predicción y Proyección
· 📐 Predicción Basada en Linreg& ATR
· 📏 Regresión Lineal FibonacciMulti-temporal
· 📈 Proyector de Flujo de Mercado Potenciado por Volumen
______________________________________________________________________________________________________
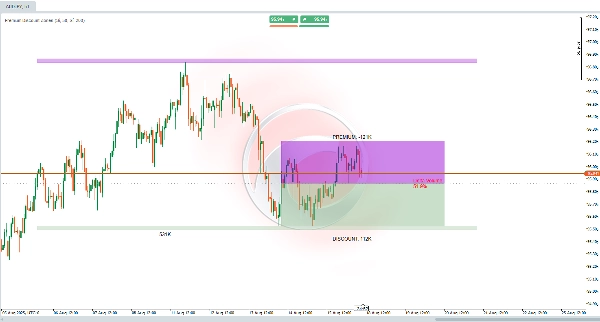
¿Qué Hace el Indicador Premium Discount Zones? 🎯
Este indicador está diseñado para ayudarte a identificar áreas clave basadas en los máximos y mínimos recientes del mercado. Analiza un período configurable de barras pasadas para determinar un rango general de precios, calcula un equilibrio en el punto medio, y divide ese rango en dos zonas principales:
- 🔺 Premium (Zona Superior)
- 🟩 Discount (Zona Inferior)
También evalúa el volumen de negociación en esas barras para calcular un "Delta de Volumen", que representa el porcentaje de volumen asociado con movimientos bajistas.
¿Para Qué Sirve? 💡
Este indicador te ayuda a detectar áreas donde el precio podría estar:
- 📈 Sobrevalorado (Zona Premium) → Potencial para vender o tomar ganancias
- 📉 Subvalorado (Zona Discount) → Potencial para comprar o acumular
Proporciona una vista rápida de desequilibrios del mercado, destacando si el volumen reciente favorece movimientos alcistas o bajistas. Las zonas estructurales extendidas proyectan niveles clave más allá del rango inmediato, útiles para planificar operaciones en tendencias o reversiones. 🚀
¡Perfecto para estrategias que apuntan a rangos de consolidación, rupturas, trading institucional o análisis de liquidez!
¿Cómo Interpretarlo? 🔍
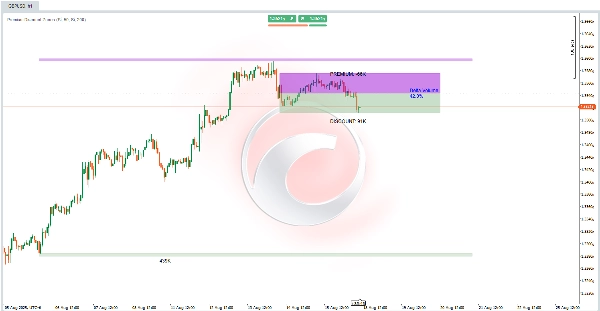
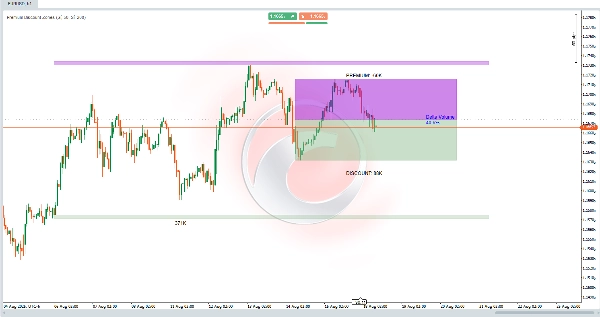
- 🟣 Zona Premium (Púrpura, Sobre el Equilibrio) → Rango superior, donde el precio se considera "caro."
- 🟢 Zona Discount (Verde, Bajo el Equilibrio) → Rango inferior, donde el precio se ve como "barato."
- ⚖️ Línea de Equilibrio (Gris, Medio) → Marca el punto medio del rango, actuando como nivel de balance. Un cruce de precio aquí puede señalar un cambio de sesgo.
- 📊 Delta de Volumen (Centro) → Muestra el % de volumen bajista (🔴 >50% = bajista, 🔵 <50% = alcista).
- 🏛 Zonas Estructurales (Extensiones Sombradas) → Áreas extendidas por encima/debajo de los extremos del rango, actuando como soporte/resistencia a largo plazo con un margen basado en la acción reciente del precio.
El indicador actualiza dinámicamente estas zonas en las barras recientes, extendiéndose hacia la derecha para proyecciones futuras.
¿Cómo Usarlo en el Trading? 🛠️
- Configuración Inicial:
-
- Habilita niveles PD (principales) y zonas estructurales si lo deseas.
- Ajusta períodos de retroceso:
-
- Corto (p. ej., 50 barras) → Rangos recientes
- Largo (p. ej., 200 barras) → Contexto estructural
- Análisis de Gráficos (p. ej., marco temporal H1):
-
- Verifica si el precio está en 🟣 Premium (considera vender con confirmación bajista) o 🟢 Discount (considera comprar con confirmación alcista).
- Usa Delta de Volumen para confirmación:
-
- 🔴 >50% → Favorece cortos en Premium
- 🔵 <50% → Favorece largos en Discount
- Estrategias de Entrada y Salida:
-
- 🟢 Comprar en Zona Discount: Si el precio entra en la zona verde y la delta es baja, busca entradas largas con stops por debajo del mínimo de la zona y objetivos en el equilibrio o Premium.
- 🟣 Vender en Zona Premium: Si el precio alcanza la zona púrpura y la delta es alta, considera cortos con stops por encima del máximo de la zona y objetivos en el equilibrio o Discount.
- 🏛 Usa Zonas Estructurales para operaciones a más largo plazo, aplicando el margen como margen de error.
Resumen
The indicator also computes a Volume Delta, representing the percentage of volume associated with bearish movements, which helps confirm market bias: values above 50% favor bearish conditions, while values below 50% favor bullish conditions. Extended structural zones project key support and resistance levels beyond the immediate range, useful for planning trades in trending or reversal markets.
Users can adjust lookback periods to focus on recent ranges or broader structural context. The indicator dynamically updates these zones and extends them forward for future projections. It supports trading strategies involving consolidation ranges, breakouts, institutional trading, and liquidity analysis by providing visual cues on price valuation and volume-driven market imbalances.


