Descrizione
▁▂▃▄▅▆▇ █ 10.000+ trader (istituzionali + retail) █ ▇▆▅▄▃▂▁
- Scegli i nostri indicatori TOP in cTrader 🏆
- ✨ Precisione esclusiva per risultati superiori ✨
- 📈 I nostri algoritmi —con le visualizzazioni più apprezzate 🎯—
- sono stati implementati con successo in 2 fondi quant
▁▂▃▄▅▆▇ █████████████████████████████ ▇▆▅▄▃▂▁
_______________________________________________
_______________________________________________
📌 Indicatori di Struttura di Mercato
· ✅ AdvancedMarket Structure: Bos, Choch, SwinLevels, Order Blocks, Market Structure& Liquidity Finder
· 🔄 Analisi Dinamica della Struttura di Mercato dei Punti di Inversione
· 🧱 Order Block
· ⛓️ BOS & CHOCH
· 🧠 ICT Power of 3
· 🌀 Zone di Polarità di Mercato
______________________________________________________________-
Store cBots : 🧠 Gold & BTC BreakoutSession Pivots 🧠
_______________________________________________
🔚 Sistemi di Uscita Intelligenti
· 📍 Algoritmo Intelligente a Inseguimento
_______________________________________________
📐 Indicatori ZigZag
· 🔍 Proiezione di Liquidità Prezzo ZigZag
· ➖ ZigZag
· 🎯 Tracciatore di Estremi Zig-Zag
_______________________________________________
🧱 Indicatori di Supporto e Resistenza
· 🟩 Linee di Supporto e Resistenza SmartTrend
· 🧱 Tutti i Livelli di Supporto e Resistenza
_______________________________________________
📊 Indicatori di Trend e Canale
· 📊 Supertrend
· ⚡Analizzatore di Trend Momentum
· 💥 Sistema di Breakout del Canale
· 🌈 Gradiente Dinamico di Trend
_______________________________________________
💧 Strumenti di Volume e Liquidità
· 📉 Mappa di Liquidazione Leva
_______________________________________________
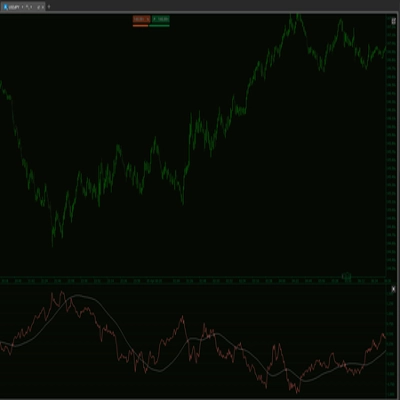
⚡ Indicatori Momentum e RSI
· 🔎 Tracciatore di Bias a Livelli Multipli di Candele
_______________________________________________
🔮 Strumenti di Predizione e Proiezione
· 📐 Predizione Basata su Linreg& ATR
· 📏 Regressione Lineare Fibonacci Multi-timeframe
· 📈 Proiettore di Flusso di Mercato Alimentato dal Volume
______________________________________________________________________________________________________
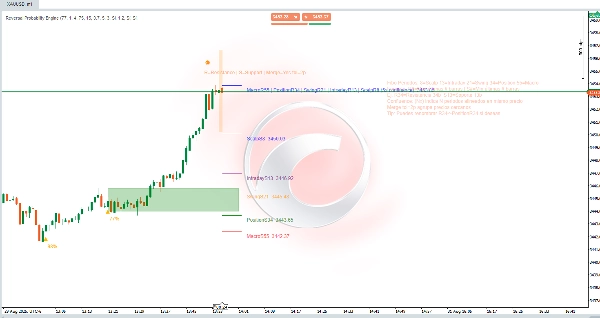
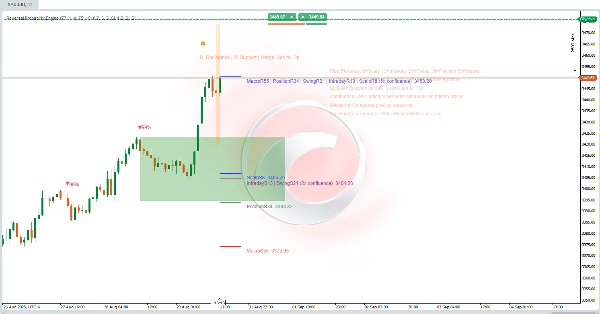
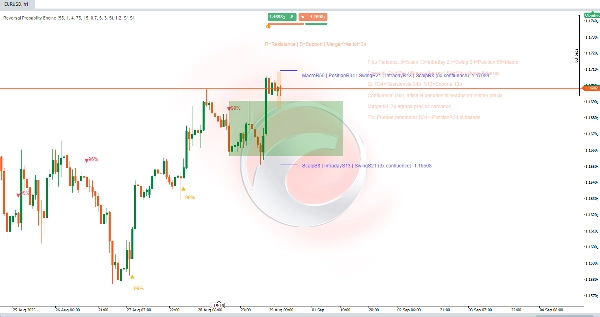
MOTORE DI PROBABILITÀ DI INVERSIONE 🔄
Un indicatore ibrido per rilevare zone di inversione + mappatura multidimensionale dei supporti e resistenze "Livelli d'Oro". Combina analisi strutturale (massimi/minimi finestre Fibonacci), dinamiche (velocità e accelerazione del prezzo), entropia/caos (ordine vs. disordine), momentum e volume per generare:
- Livelli gerarchici di supporto/resistenza per orizzonte temporale.
- Segnali probabilistici di potenziale inversione (picchi e valli) con % di confidenza. ⚠️
- Zone attive (rettangolo) per contestualizzare operazioni e stop.
- Cluster di confluenza (quando più timeframe coincidono allo stesso prezzo). 🎯
2. Obiettivo
Ridurre il rumore visivo e facilitare le decisioni identificando:
- Dove il prezzo è stato compresso o ancorato su vari orizzonti.
- Dove la probabilità statistica di inversione aumenta (confermata o anticipata). 📊
- Quali livelli hanno il maggior "peso" (confluenza).
3. Logica Concettuale
a) Livelli: Per ogni finestra Fibonacci si prendono il massimo (R) e minimo (S) recenti; questo fornisce una scala frattale di contesti (ultra-corto a macro).
b) Fusione: Se diversi livelli distinti cadono entro X pips, vengono raggruppati → un cluster con etichetta combinata e conteggio di confluenza.
c) Segnali di Inversione: Si cercano pattern di esaurimento locale (forma d'onda), decelerazione (cambio di pendenza), calo di entropia basso (entropia bassa = movimento più direzionale predisposto a invertire), possibili divergenze interne e validazioni momentum/volume.
d) Modalità Predittiva: Permette di anticipare inversioni (diamante) prima della conferma completa se accelerazione contraria + entropia bassa + stato estremo si allineano. 💎
e) Probabilità: Ponderazione normalizzata di vari fattori (trend, caos, momentum, volume, divergenza, adattamento). Risultato troncato 40–99%.
f) Zona Attiva: Dopo un segnale, si cerca l'intervallo più logico (tra livelli rilevanti) per gestire l'operazione e contestualizzare gli stop.
4. Componenti Visive
- Linee orizzontali: Livelli per periodo (Scalp 8, Intraday 13, Swing 21, Position 34, Macro 55). Colore coerente per orizzonte.
- Etichette R#/S#: R = Resistenza (massimo recente di quella finestra), S = Supporto (minimo recente). Es.: R34 = resistenza derivata dalle ultime 34 candele.
- Etichette unite:
ScalpS8 | IntradayS13 | … (5x confluenza) Prezzo. Indica che N periodi distinti producono lo stesso livello (o entro tolleranza). Più sono, maggiore è la rilevanza. ✅ - (Nx confluenza): Numero di periodi coincidenti.
- Tolleranza di fusione=Xp: Tolleranza in pips che raggruppa livelli vicini (evita saturazione).
- Probabilità (%): Testo sopra/sotto triangoli (Giù / Su) o diamante (rilevamento precoce).
- Rettangolo verde (zona attiva): Canale operativo dinamico dove si valuta l'evoluzione post-segnale.
- Blocchi/colori sottili aggiuntivi: Elementi di supporto (onde/particelle) se attivati.
5. Interpretazione Pratica
- Alta confluenza (≥3x) = forte "magnete" o livello pivot; osservare la reazione del prezzo. 🧲
- Segnale + confluenza vicina rinforza la validità (ma non garantisce).
- Probabilità ≥ Min % di Confidenza: Filtro minimo per considerare l'azione.
- Differenziare Anticipato (diamante) vs. Confermato (triangolo): L'anticipato offre migliore rischio/rendimento, tasso di falsi più alto; il confermato arriva con meno asimmetria ma più validazione.
- Rettangolo: Se il prezzo rimane all'interno e non invalida il bordo opposto, la tesi rimane valida; una rottura netta riduce l'aspettativa.
- Espandi o riduci la Tolleranza di Fusione: Minore = maggiore granularità, Maggiore = cluster più sintetizzati.
6. Flusso d'Uso
- Carica l'indicatore sullo strumento e timeframe desiderati.
- Regola la % Min di Confidenza secondo la tolleranza (es. più bassa per scalping, più alta per swing).
- Verifica se appare un cluster multiplo di supporto/resistenza (5x, 4x, ecc.).
- Attendi un segnale (ideale se nasce alla periferia del cluster e con alta probabilità). 🔔
- Delimita la gestione all'interno della zona attiva: ingresso scaglionato o conferma di breakout fallito.
- Definisci uno stop logico: oltre il primo livello inferiore (in long) o superiore (in short) non presente nella confluenza.
- Disattiva i periodi che non usi (es. solo Swing/Macro per posizioni long).
- Regola la tolleranza e, opzionalmente, nascondi il pannello esplicativo una volta appreso.
7. Esempio Rapido di Lettura Etichetta
ScalpS8 | IntradayS13 | SwingS21 | PositionS34 | MacroS55 (5x confluenza)
Significato: Tutti i timeframe (8–55) condividono lo stesso livello → supporto strutturale multi-scala. Maggiore probabilità di reazione; se perso con volume, implica un cambiamento di regime più serio. 🚨
Riepilogo
Key features include:
- Hierarchical support and resistance levels categorized by time horizons (from ultra-short scalp to macro scales).
- Probabilistic reversal signals indicating potential peaks and valleys with confidence percentages.
- Active zones displayed as rectangles to help contextualize trade entries and stop placements.
- Confluence clusters that highlight price levels confirmed across multiple timeframes, enhancing level significance.
The indicator reduces visual noise by grouping nearby levels within a tolerance range and provides clear visual components such as horizontal lines, labeled resistance/support points, merged confluence labels, probability percentages, and active zones. It distinguishes between anticipated and confirmed reversal signals, offering traders options for risk management and trade timing.
Users can adjust confidence thresholds and merge tolerances to tailor granularity and filtering according to their trading style and timeframe. The tool supports structured decision-making by identifying statistically significant reversal areas and multi-scale support/resistance clusters on any instrument and timeframe.
Recensioni dei clienti
5 | 0 % | |
4 | 0 % | |
3 | 0 % | |
2 | 0 % | |
1 | 100 % |