説明
Pinescriptlabs ストアインジケーター: Pinescriptlabs ストア cBots : (cBot) Gold & BTC ブレイクアウトセッションピボット(新着)
高度なマーケット構造:Bos、Choch、SwinLevels、オーダーブロック、 マーケット構造&流動性ファインダー (新着)
トレーリングスマートアルゴリズム (新着)
🌟 チームの素晴らしい努力でこのCtraderインジケーターが開発されました! シェアしてサポートしてください - 水平スクロールなどの視覚的改善がまもなく登場します!
⚠️ 技術的注意: 最適な表示のために現在は手動ズーム/スクロールが必要です (「一時的な制限:Ctraderプラットフォームの視覚的制約により1時間未満のタイムフレームで最適に動作」)
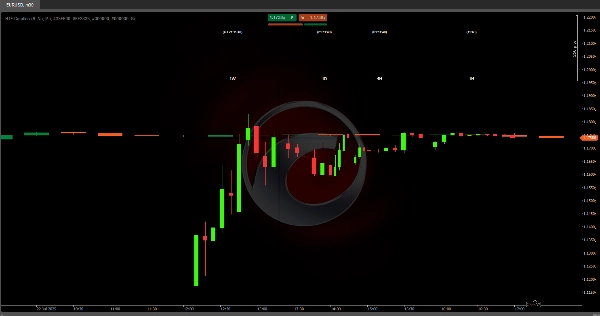
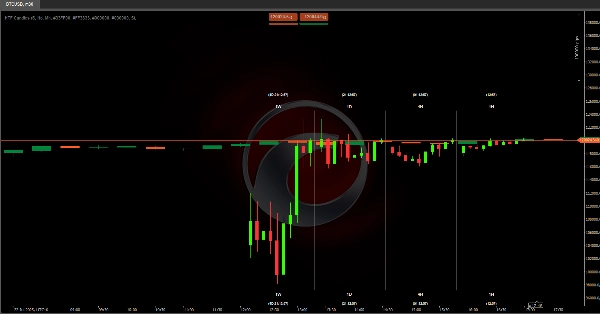
📊 リアルタイムHTFビジュアライゼーション
このアルゴリズムは、より高いタイムフレームのローソク足(1W、1D、4H、1H)を直接トレーディングチャートに表示し、市場構造を一目で把握できます - ウィンドウ切り替えは不要です!
🔍 クイック分析
低いタイムフレームで取引しながら主要なトレンド(日次/週次の方向)を見つける
• 高度な機能: HTFローソク足はリアルタイムで更新され、色の変化でモメンタムの変化を即座に表示します
⚙️ 使い方
• 個別のHTFブロックのオン/オフ切り替え
• 表示ローソク足の調整(タイムフレームごとに1~10本)
💡 ゲームチェンジングな利点
今すぐできること:
1️⃣ 重要なローソク足のクローズを予測
2️⃣ ライブでトレンドの反転を検出
3️⃣ 複数のタイムフレームで重要なレベルを同時に監視
🚀 今後の改善
水平スクロールにより以下が可能になります:
• 過去のHTFパターン分析
• 現在と過去の構造比較
• 高いタイムフレームでの重要ゾーンの特定
📚 実用例
• 1Wが緑で1Dが赤の場合 → 市場は強気トレンド内で調整中 → 重要なレジスタンスでの反発時のみショート
• トレンド階層: 1W > 1D > 4H > 1H → 常に週次ローソク足の方向に従って取引
• コンフルエンスエントリー:
- 1Dのサポート付近の価格 + 出現中の緑の4Hローソク足 = ロングのチャンス
- 1Hの高値でのレジスタンス + 赤の4Hローソク足 = 高値上にストップを置いたショート
• ブレイクアウトパターン: - 1Hローソク足がクローズ前に前の高値を突破した場合(タイマー作動中)、強気の継続を期待
概要
Users can toggle individual higher timeframe candle blocks on or off and adjust the number of visible candles per timeframe (1 to 10). This facilitates monitoring of key levels and trend directions across multiple timeframes simultaneously. Practical use cases include anticipating candle closings, detecting live trend reversals, and identifying confluence entries based on support, resistance, and candle color changes.
Due to platform visual constraints, manual zoom and scroll are currently required for optimal viewing, especially on timeframes below 1 hour. Planned updates will introduce horizontal scrolling to enable historical pattern analysis, comparison of current versus past structures, and identification of key zones on higher timeframes.
HTF Candles supports traders in aligning trades with higher timeframe trends and enhances multi-timeframe market analysis within a single chart view.