Opis
🚀 Ponad 10 000 traderów już korzysta z naszych NAJLEPSZYCH wskaźników🏆
Dowiedz się, dlaczego profesjonaliści wybierają nas – najpotężniejsze narzędzia na cTrader (wskaźniki, algorytmy i cBoty) czekają na Ciebie.
👉 Pobierz wszystkie nasze NAJLEPSZE systemy tutaj:
_______________________________________________
📌 Wskaźniki Struktury Rynku
· ✅ AdvancedMarket Structure: Bos, Choch, SwinLevels, Order Blocks, Market Structure& Liquidity Finder
· 🔄 Dynamic Market StructureAnalysis of Turning Points
· 🧱 Order Block
· ⚖️ Market Imbalance
· ⛓️ BOS & CHOCH
· 🧠 ICT Power of 3
_______________________________________________
🔚 Inteligentne Systemy Wyjścia
_______________________________________________
📐 Wskaźniki ZigZag
· 🔍 ZigZag Price LiquidityProjection
· ➖ ZigZag
_______________________________________________
🧱 Wskaźniki Wsparcia i Oporu
· 🟩 SmartTrend Support &Resistance Lines
· 🧱 All Support and ResistanceLevels
_______________________________________________
📊 Wskaźniki Trendu i Kanału
· 📊 Supertrend
_______________________________________________
💧 Narzędzia Wolumenu i Płynności
_______________________________________________
⚡ Wskaźniki Momentum i RSI
· 🔎 Multi-Level Candle Bias
Tracker
_______________________________________________
🔮 Narzędzia Prognozowania i Projekcji
· 📐 Prognoza oparta na Linreg& ATR
· 📏 Fibonacci Linear RegressionMulti-timeframe
· 📈 Projektor przepływu rynku zasilany wolumenem
______________________________________________________________________________________________
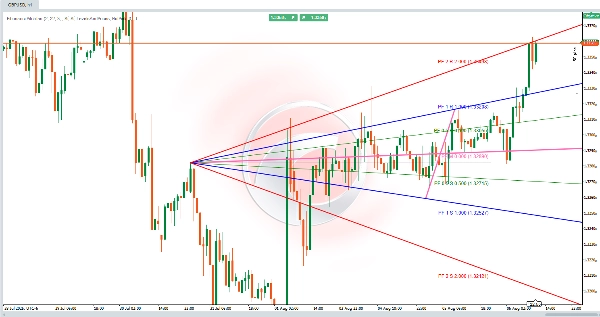
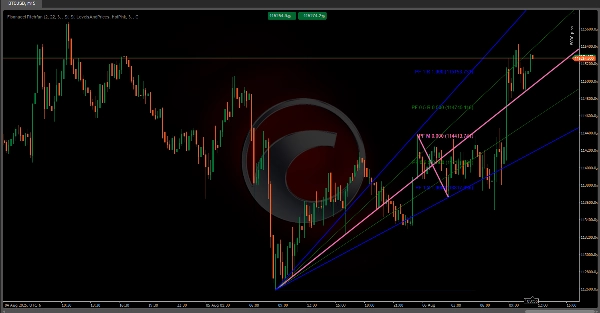
Fibonacci Pitchfan 📊✨
Zaawansowany wskaźnik techniczny, który łączy wykrywanie pivotów, dynamiczne linie trendu oraz poziomy Fibonacciego, tworząc wizualne narzędzie pomagające traderom identyfikować trendy, strefy wsparcia/oporu oraz potencjalne punkty odwrócenia. 🎯 Wysoce konfigurowalny, dostosowuje się do różnych stylów handlu dzięki parametrom konfigurowalnym. Poniżej znajduje się opis jego logiki i obliczeń.
Główne składniki 🔧
Wskaźnik opiera się na trzech kluczowych elementach współpracujących ze sobą:
1. Wykrywanie pivotów 🔄
- Identyfikuje kluczowe punkty odwrócenia ceny (pivoty wysokie/niskie).
- Używa zakresu słupków zdefiniowanego przez użytkownika (głębokość pivotu), aby określić, czy słupek jest znaczącym maksimum/minimum w porównaniu z otaczającymi słupkami.
- Filtruje szumy, wymagając, aby pivoty przekraczały próg odchylenia opartego na ATR, zapewniając, że brane są pod uwagę tylko istotne wahania cen.
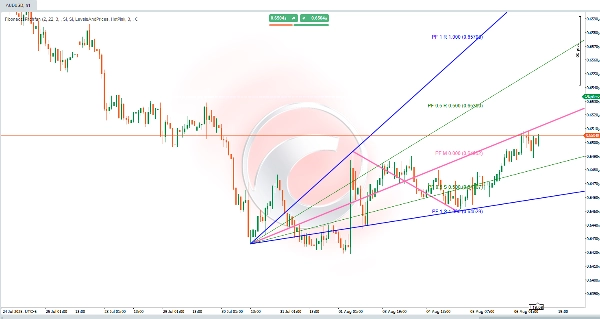
2. TrendFan i poziomy Fibonacciego 📐
- Projekcja wachlarza dynamicznych linii trendu od historycznego pivotu w przyszłość, wykorzystując zdefiniowane poziomy (np. 0,25, 0,5, 1,0) do oznaczenia potencjalnych stref wsparcia/oporu.
- Opcjonalne poziomy Fibonacciego (linie poziome) podkreślają zniesienia/ekstensje między kluczowymi pivotami.
Logika obliczeń 🧮
1. Identyfikacja pivotów
- Dla każdego słupka algorytm skanuje symetryczny zakres wcześniejszych/następnych słupków (w oparciu o głębokość pivotu).
- Pivot wysoki jest potwierdzony, jeśli maksimum słupka jest najwyższe w zakresie; pivot niski, jeśli minimum jest najniższe.
- Próg odchylenia (procent ATR względem ceny) filtruje drobne fluktuacje, skupiając się na istotnych ruchach rynku.
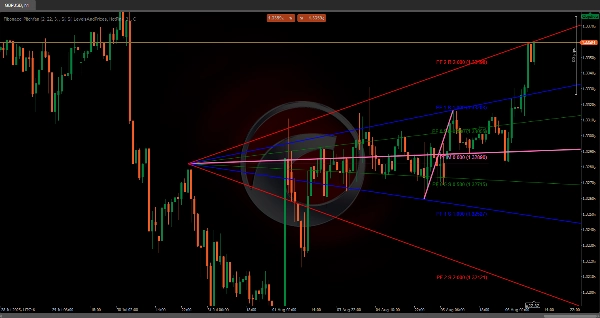
2. Generowanie TrendFan 🌪️
- Referencyjny historyczny pivot (konfigurowalny) jest sparowany z najnowszym pivotem, tworząc linię bazową.
- Rysowana jest linia środkowa między nimi, a projekcje linii trendu (na zdefiniowanych poziomach) rozciągają się w przyszłość, tworząc "wachlarz" kluczowych stref cenowych.
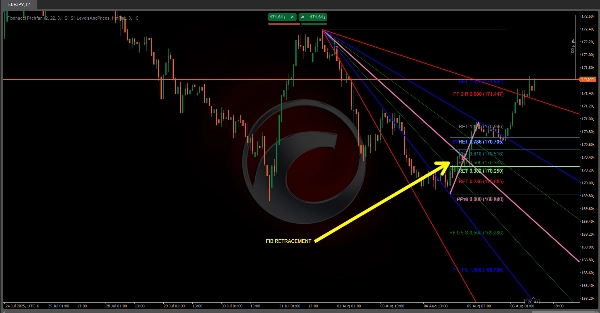
3. Projekcje Fibonacciego 🔢
- Poziomy zniesienia (np. 0,236, 0,5, 0,618) oznaczają potencjalne obszary cofnięcia w poprzednim ruchu cenowym.
- Poziomy rozszerzenia prognozują cele cenowe poza początkowym zakresem, dostosowane do kierunku trendu.
- Poziomy mogą być odwrócone lub rozszerzone w zależności od ustawień użytkownika.
Ustawienia konfigurowalne ⚙️
- Próg odchylenia: Reguluje czułość na ruchy cenowe (oparte na ATR).
- Głębokość pivotu: Definiuje zakres słupków do wykrywania pivotów (wpływa na częstotliwość sygnałów).
- Referencja historyczna: Ustawia, jak daleko wstecz wybierany jest początkowy pivot dla TrendFan.
- Widoczność: Przełącza wyświetlanie TrendFan/Fibonacciego i wybiera konkretne poziomy do pokazania.
Podsumowanie 🏆
Fibonacci Pitchfan to potężne narzędzie all-in-one dla traderów poszukujących jasnego, dynamicznego obrazu struktury rynku. Łącząc pivoty, linie trendu i poziomy Fibonacciego, dostarcza praktycznych wskazówek do przewidywania ruchów cen i podejmowania świadomych decyzji. 🚀
Podsumowanie
It generates a "TrendFan" by projecting dynamic trendlines from a configurable historical pivot to the latest pivot, creating a fan of key price zones. Optional Fibonacci retracement and extension levels highlight potential pullback areas and price targets, which can be customized or inverted according to user preferences.
Key customizable settings include deviation threshold sensitivity, pivot depth (bar range for pivot detection), historical reference for the initial pivot selection, and visibility options for TrendFan and Fibonacci levels. This tool is suitable for traders seeking actionable insights to anticipate price movements and make informed decisions based on a comprehensive view of market dynamics.