الوصف
🚀 أكثر من 10,000 متداول يستخدمون بالفعل أفضل المؤشرات🏆
اكتشف لماذا يختارنا المحترفون – أقوى الأدوات على cTrader (المؤشرات، الخوارزميات، وcBots) في انتظارك.
👉 احصل على جميع أنظمتنا الأفضل هنا:
_______________________________________________
📌 مؤشرات هيكل السوق
· ✅ هيكل السوق المتقدم: Bos, Choch, SwinLevels, كتل الأوامر، هيكل السوقومكتشف السيولة
· 🔄 تحليل هيكل السوق الديناميكي لنقاط التحول
· 🧱 كتلة الأوامر
· ⚖️ اختلال السوق
· ⛓️ BOS & CHOCH
· 🧠 قوة ICT 3
_______________________________________________
🔚 أنظمة الخروج الذكية
_______________________________________________
📐 مؤشرات ZigZag
· ➖ ZigZag
_______________________________________________
🧱 مؤشرات الدعم والمقاومة
· 🟩 خطوط دعم ومقاومة SmartTrend
· 🧱 جميع مستويات الدعم والمقاومة
_______________________________________________
📊 مؤشرات الاتجاه والقناة
· 📊 سوبرتريند
· ⭐ قناة SSL المميزة
_______________________________________________
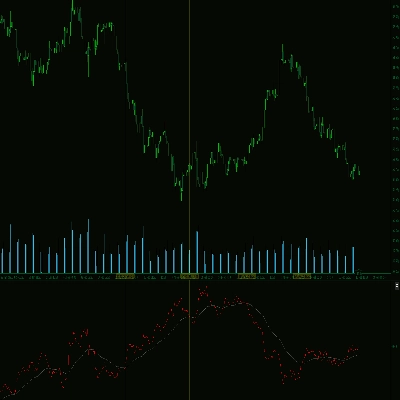
💧 أدوات الحجم والسيولة
· 📉 خريطة تصفية الرافعة المالية
_______________________________________________
⚡ مؤشرات الزخم وRSI
· 📈 مُشغل اتجاه RSI
· 🔎 مُتتبع ميل الشمعة متعدد المستويات
Tracker
_______________________________________________
🔮 أدوات التنبؤ والتوقع
· 📐 التنبؤ بناءً على Linreg& ATR
· 📏 انحدار فيبوناتشي الخطي متعدد الأطر الزمنية
· 📈 عارض تدفق السوق المدعوم بالحجم
________________________________________________________________________________________________________
________________________________________________________________________________________________________
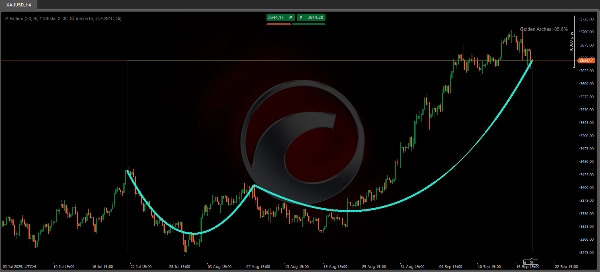
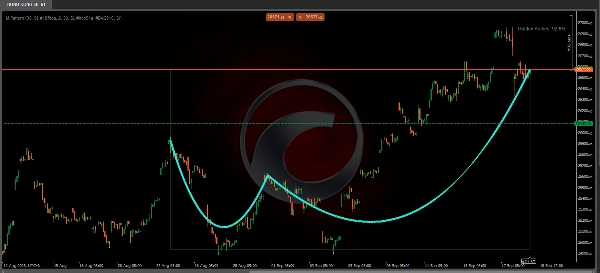
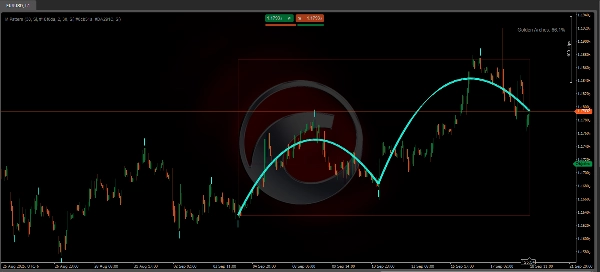
منحنى بيزييه لنمط ماكدونالدز 🍟
ما الغرض منه؟ 🤔
مؤشر "منحنى بيزييه لنمط ماكدونالدز" مصمم لتحديد وتصور أنماط انعكاس السعر باستخدام منحنيات بيزييه. الهدف الرئيسي منه هو اكتشاف هياكل السوق التي تشبه الأقواس (مماثلة لـ "M" أو "W") على الرسوم البيانية، والتي قد تشير إلى تغيرات محتملة في الاتجاه 🎯. بالإضافة إلى ذلك، يتضمن نظام تسجيل لتقييم جودة النمط المكتشف.
كيف يعمل؟ ⚙️
- كشف النقاط المحورية:
يقوم المؤشر بتحليل فترة مراجعة (محددة بواسطة "فترة المراجعة") لتحديد القمم والقيعان المحلية (النقاط المحورية). يتم تمييزها بدوائر على الرسم البياني: ⚪ - منحنيات بيزييه:
بمجرد اكتشاف ما لا يقل عن 5 نقاط محورية، يرسم المؤشر قوسين باستخدام منحنيات بيزييه التي تربط هذه النقاط. تهدف هذه الأقواس إلى تنعيم الانتقال بين النقاط المحورية لتشكيل هيكل بصري مشابه لـ الأقواس التوأم ("الأقواس الذهبية") 🏛️. - المنطقة الملونة:
إذا تم تفعيلها، يتم رسم منطقة بين النقطة المحورية الأولى والأخيرة. يعتمد لون هذه المنطقة على اتجاه النمط: -
- 🟢 أخضر: اتجاه صاعد (إذا كانت النقطة المحورية الأخيرة أعلى).
- 🔴 أحمر: اتجاه هابط (إذا كانت النقطة المحورية الأخيرة أدنى).
- درجة النمط:
يحسب نسبة مئوية تعكس تماثل وجودة الأقواس. تشير درجة أعلى إلى نمط معرف بشكل أفضل.
هل يعيد الرسم (إعادة التمثيل)؟ 🔄
نعم، هذا المؤشر يعيد الرسم. هذا يعني أن رسوماته واكتشافاته يمكن أن تتغير بأثر رجعي مع الحصول على بيانات سعر جديدة. وذلك لأن تحديد تلك النقاط الانعطافية يعتمد على مراقبة عدد معين من الشموع بعد تكوين النقطة المحورية المحتملة. لذلك، ما يبدو كقوس مؤكد في البيانات التاريخية قد يتم تعديله أو يختفي عند تطبيقه على الرسوم البيانية الحية 📊.
يمكن استخدامه كـ مساعدة تكميلية في التحليل الفني.
كيف يمكن استخدامه؟ 💡
- 📚 تحليل الاختبار الخلفي:
مفيد لدراسة الأنماط التاريخية وتقييم فعاليتها على أصول أو أطر زمنية مختلفة. - 👁️ التأكيد البصري:
يمكن أن يكمل أدوات التحليل الأخرى (مثل الدعم/المقاومة أو المتوسطات المتحركة) للتحقق من الانعكاسات المحتملة. - 🎓 التعليم:
يساعد في التعرف على هياكل السوق بناءً على منحنيات بيزييه، رغم أن استخدامه في التداول الحي يتطلب التحقق الإضافي.
القيود والتوصيات ⚠️
- الاستخدام في الوقت الحقيقي:
نظرًا لأنه يعيد الرسم، لا ينبغي استخدامه كإشارة مستقلة للدخول أو الخروج من السوق. - التحسين:
قم بضبط "فترة المراجعة" حسب الأصل والإطار الزمني لتقليل الإشارات الخاطئة. - سياق السوق:
يعمل بشكل أفضل في الأسواق المتجهة وليس في الأسواق الجانبية/المتذبذبة.
ملاحظة مهمة: 🚨
نظرًا لاعتماده على بيانات مستقبلية للتأكيد، يجب استخدامه بشكل أساسي لتحليل الأحداث التي حدثت بالفعل، مثل الانخفاضات بعد فتح السوق أو تمارين الرسم البياني التعليمية، بدلاً من الأغراض التنبؤية أو التداول الحي. على الرغم من أن منهجه مبتكر، يجب استخدامه جنبًا إلى جنب مع مؤشرات وتحليلات أخرى لتجنب الإشارات الخاطئة بسبب طبيعته التي تعيد الرسم. إنه مثالي لـ دراسات الاختبار الخلفي أو كمكمل تعليمي في استراتيجيات التداول.
الملخص
This tool repaints, meaning its visualizations and detections can change retroactively as new price data arrives, so it is best used for backtesting, educational purposes, or as a complementary aid alongside other technical analysis tools. It is optimized for trending markets and requires adjustment of the lookback period to suit different assets and timeframes. The indicator supports markets including Forex (e.g., EURUSD), commodities (e.g., XAUUSD), and cryptocurrencies (e.g., BTCUSD).