Açıklama
🚀 10.000'den fazla tüccar zaten en iyi göstergelerimizi🏆 kullanıyor
👉 Tüm en iyi sistemlerimizi buradan edinin:
_______________________________________________
📌 Piyasa Yapısı Göstergeleri
· ✅ AdvancedMarket Structure: Bos, Choch, SwinLevels, Order Blocks, Market Structure& Likidite Bulucu
· 🔄 Dinamik Piyasa Yapısı Dönüş Noktalarının Analizi
· 🧱 Order Block
· ⚖️ Piyasa Dengesizliği
· ⛓️ BOS & CHOCH
· 🧠 ICT Power of 3
_______________________________________________
🔚 Akıllı Çıkış Sistemleri
_______________________________________________
📐 ZigZag Göstergeleri
· 🔍 ZigZag Fiyat Likidite Projeksiyonu
· ➖ ZigZag
· 🎯 Zig-Zag Uç Nokta Takipçisi
_______________________________________________
🧱 Destek & Direnç Göstergeleri
· 🟩 SmartTrend Destek & Direnç Çizgileri
· 🧱 Tüm Destek ve Direnç Seviyeleri
_______________________________________________
📊 Trend & Kanal Göstergeleri
· 📊 Süpertrend
· 🧠 Uyarlanabilir Trend Kanalı
· 🔁 Reaktif Hareketli Ortalama
_______________________________________________
💧 Hacim & Likidite Araçları
· 🔍 Momentum Adil Değer Boşluğu
· 🕒 Adil Değer Boşluğu Oturumları
_______________________________________________
⚡ Momentum & RSI Göstergeleri
· 🔎 Çok Katmanlı Mum Eğilimi
Takipçisi
_______________________________________________
🔮 Tahmin & Projeksiyon Araçları
· 📐 Linreg & ATR Tabanlı Tahmin
· 📏 Fibonacci Doğrusal Regresyon Çok Zamanlı
· 📈 Hacim Destekli Piyasa Akışı Projeksiyonu
________________________________________________________________________________________
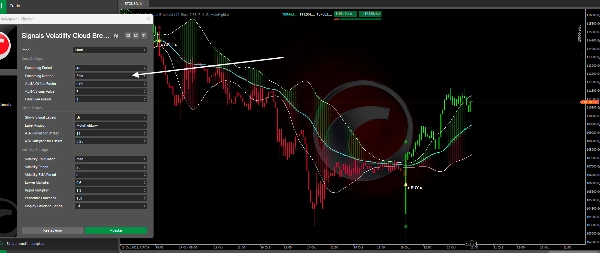
SİNYALLER VOLATİLİTE BULUTU KOPUŞU.
Genel Bakış 💡
Adaptive Trend Bands, uyarlanabilir fiyat filtrelemesini dinamik volatilite bantlarıyla birleştiren gelişmiş bir trend takip göstergesidir. Geleneksel statik bant göstergelerinin aksine, bu sistem piyasa koşullarındaki değişikliklere göre hassasiyetini otomatik olarak ayarlar ve farklı volatilite ortamlarında daha doğru sinyaller sağlar. 🎯
Bu Gösterge Ne Yapar? 🤔
Gösterge, piyasa gürültüsünü ortadan kaldıran filtrelenmiş ve yumuşatılmış bir fiyat (OHLC) temsili oluşturur, böylece temel trend daha net bir şekilde görselleştirilebilir. Aynı zamanda, mevcut volatiliteye bağlı olarak otomatik genişleyen veya daralan üst ve alt bantları hesaplar, sakin veya dalgalı piyasalara uyum sağlar. 🌊
Ana Özellikler: ✨
- ALMA veya EMA algoritmaları kullanarak uyarlanabilir fiyat filtreleme
- Tarihsel yüzdeliklere göre dinamik olarak ayarlanan volatilite bantları
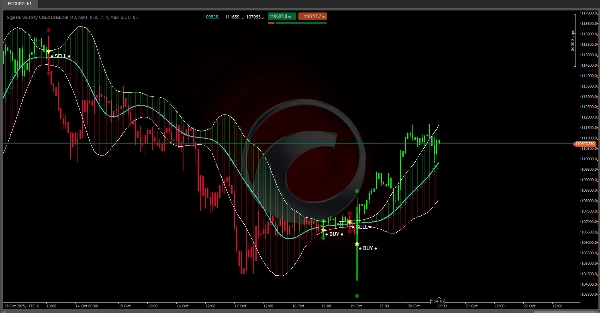
- Fiyat bantları geçtiğinde görsel AL/SAT sinyalleri 🟢🔴
- Tespit edilen trende göre mum renklendirmesi (yeşil yükseliş / kırmızı düşüş)
- Filtrelenmiş çizgiler arasındaki renkli bulutlar ile trend gücünün görselleştirilmesi 💪
Nasıl Çalışır? ⚙️
Filtreleme Sistemi
Gösterge, fiyata iki aşamalı bir yumuşatma işlemi uygular:
- Birinci Katman: Kısa vadeli dalgalanmaları ortadan kaldırmak için ALMA (Arnaud Legoux Hareketli Ortalaması) veya geleneksel EMA filtreleri kullanır. ALMA, gecikmeyi azaltırken yumuşaklığı koruduğu için özellikle etkilidir.
- İkinci Katman: İlk filtrenin sonucuna ek bir EMA yumuşatma uygular, fiyat değişikliklerine dengeli tepki veren ultra yumuşak bir trend çizgisi oluşturur.
Uyarlanabilir Volatilite Hesaplaması 📏
Sistem, piyasa volatilitesini iki yöntemle ölçer:
- Standart Sapma (StdDev): Klasik dağılım ölçüm yöntemi
- Ortalama Mutlak Sapma (MAD): Aşırı değerlere karşı daha dayanıklı
Hesaplanan volatilite yumuşatılır ve geçmiş volatilite geçmişiyle karşılaştırılarak yüzdelik sırası belirlenir. Bu yüzdelik, bant çarpanını kontrol eder:
- Düşük Volatilite (düşük yüzdelik): Bantlar fiyata daha yakın 🤏
- Yüksek Volatilite (yüksek yüzdelik): Bantlar daha geniş, hareket için alan sağlar 🌐
Sinyal Üretimi 🔔
Sinyaller, gerçek fiyat uyarlanabilir bantları geçtiğinde etkinleşir:
- Bir sinyal etkinleştirildiğinde, gösterge karşıt geçiş gerçekleşene kadar trend durumunu korur, konsolidasyon bölgelerinde erken sinyalleri önler. 🛡️
Ne İçin Kullanılır? 🛠️
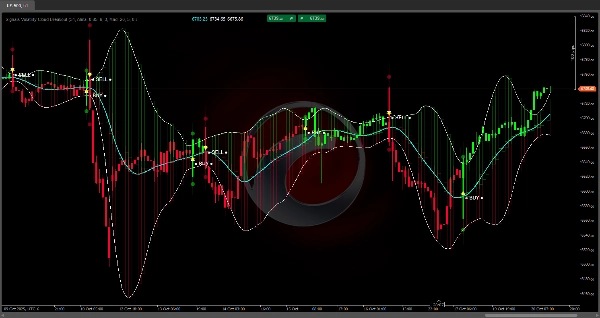
Trend Tanımlama 👀
Gösterge, tespit edilen trendin yönüne göre mumları renklendirir, böylece piyasanın yükseliş mi yoksa düşüş aşamasında mı olduğunu hızlıca belirlemenizi sağlar. Filtrelenmiş çizgiler arasındaki renkli bulutlar, hareketin gücünü ve yönünü görsel olarak pekiştirir.
Giriş ve Çıkış Noktaları ➡️🚪
Belirgin simgelerle işaretlenen AL/SAT sinyalleri, piyasaya girme veya çıkma için potansiyel anları gösterir. Bu sinyaller, fiyatın uyarlanabilir bantları aşmak için yeterli momentuma sahip olduğu trend başlangıçlarını yakalamayı amaçlar.
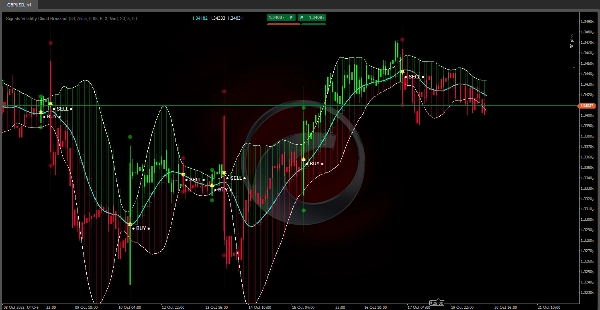
Pozisyon Yönetimi 💼
Üst ve alt bantlar, aşağıdaki referans seviyeleri olarak görev yapar:
- Dinamik durdurma noktalarının belirlenmesi
- Göreceli aşırı alım/aşırı satım bölgelerinin tespiti 🏷️
- Bir trendin gücünü kaybedip kaybetmediğinin değerlendirilmesi (fiyatın merkezi çizgiye doğru geri çekilmesi) 📉
Özet
Key features include visual BUY/SELL signals triggered when price crosses the adaptive bands, candle coloring to indicate bullish or bearish trends, and colored clouds between filtered lines to represent trend strength. The bands also serve as dynamic reference levels for setting stops, identifying overbought or oversold conditions, and assessing trend strength. This indicator supports various markets including Forex, Crypto, Stocks, and symbols such as BTCUSD, EURUSD, GBPUSD, XAUUSD, and USDJPY. It is intended for trend identification, entry and exit timing, and position management within diverse trading environments.