
Mô tả
🚀 Hơn 10.000 nhà giao dịch đã sử dụng các chỉ báo hàng đầu của chúng tôi 🏆
👉 Nhận tất cả các hệ thống hàng đầu của chúng tôi tại đây:
_______________________________________________
📌 Chỉ báo Cấu trúc Thị trường
· ✅ AdvancedMarket Structure: Bos, Choch, SwinLevels, Order Blocks, Market Structure& Liquidity Finder
· 🔄 Dynamic Market StructureAnalysis of Turning Points
· 🧱 Order Block
· ⚖️ Market Imbalance
· ⛓️ BOS & CHOCH
· 🧠 ICT Power of 3
_______________________________________________
🔚 Hệ thống Thoát Thông minh
· 📍 Thuật toán Thông minh Theo dõi
_______________________________________________
📐 Chỉ báo ZigZag
· 🔍 ZigZag Price LiquidityProjection
· ➖ ZigZag
_______________________________________________
🧱 Chỉ báo Hỗ trợ & Kháng cự
· 🟩 SmartTrend Support &Resistance Lines
· 🧱 All Support and ResistanceLevels
_______________________________________________
📊 Chỉ báo Xu hướng & Kênh
· 📊 Supertrend
_______________________________________________
💧 Công cụ Khối lượng & Thanh khoản
_______________________________________________
⚡ Chỉ báo Động lượng & RSI
· 🔎 Multi-Level Candle Bias
Tracker
_______________________________________________
🔮 Công cụ Dự đoán & Chiếu dự
· 📐 Dự đoán dựa trên Linreg& ATR
· 📏 Fibonacci Linear RegressionMulti-timeframe
· 📈 Volume-Powered Market Flow Projector
________________________________________________________________________________________
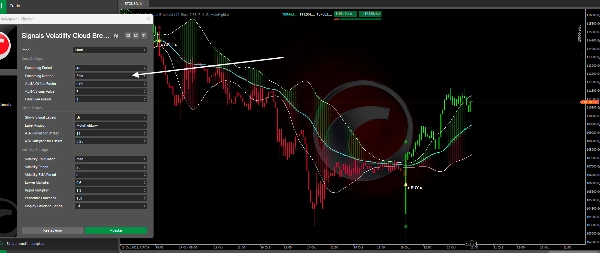
TÍN HIỆU PHÁ VỠ ĐÁM MÂY BIẾN ĐỘNG.
Tổng quan chung 💡
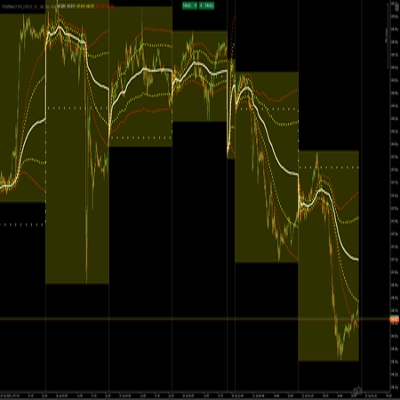
Adaptive Trend Bands là một chỉ báo theo xu hướng tiên tiến kết hợp lọc giá thích ứng với các dải biến động động. Khác với các chỉ báo dải tĩnh truyền thống, hệ thống này tự động điều chỉnh độ nhạy theo điều kiện thị trường thay đổi, cung cấp tín hiệu chính xác hơn trong các môi trường biến động khác nhau. 🎯
Chỉ báo này làm gì? 🤔
Chỉ báo tạo ra một biểu diễn đã được lọc và làm mượt của giá (OHLC) loại bỏ nhiễu thị trường, cho phép xu hướng cơ bản được nhìn thấy rõ ràng hơn. Đồng thời, nó tính toán các dải trên và dưới tự động mở rộng hoặc co lại dựa trên biến động hiện tại, thích ứng với thị trường yên tĩnh hoặc biến động. 🌊
Các tính năng chính: ✨
- Lọc giá thích ứng sử dụng thuật toán ALMA hoặc EMA
- Các dải biến động điều chỉnh động dựa trên phần trăm lịch sử
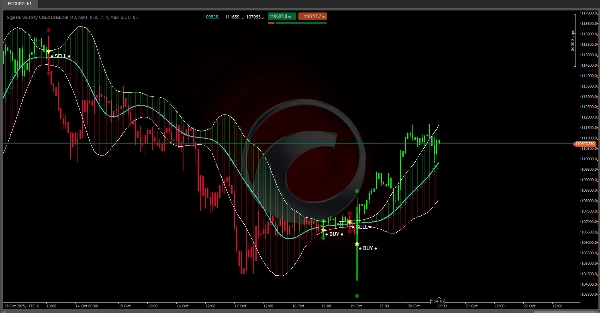
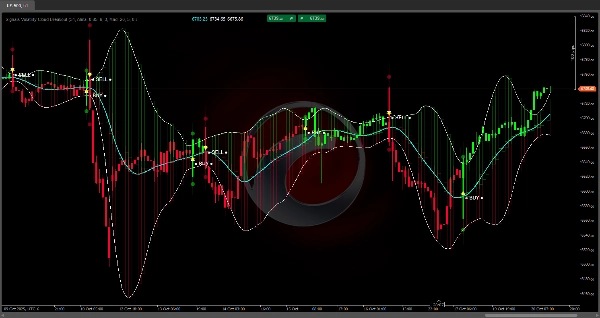
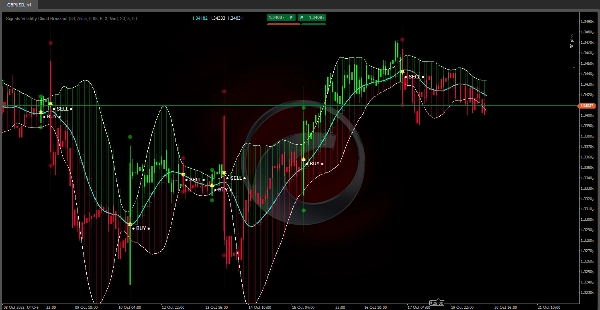
- Tín hiệu MUA/BÁN trực quan khi giá vượt qua các dải 🟢🔴
- Tô màu nến dựa trên xu hướng được phát hiện (xanh tăng / đỏ giảm)
- Đám mây màu giữa các đường lọc để trực quan hóa sức mạnh xu hướng 💪
Nó hoạt động như thế nào? ⚙️
Hệ thống lọc
Chỉ báo áp dụng quá trình làm mượt hai giai đoạn cho giá:
- Lớp đầu tiên: Sử dụng ALMA (Trung bình động Arnaud Legoux) hoặc bộ lọc EMA truyền thống để loại bỏ dao động ngắn hạn. ALMA đặc biệt hiệu quả vì nó giảm độ trễ trong khi vẫn giữ được độ mượt.
- Lớp thứ hai: Áp dụng làm mượt EMA bổ sung cho kết quả của bộ lọc đầu tiên, tạo ra đường xu hướng cực kỳ mượt mà phản ứng cân bằng với sự thay đổi giá.
Tính toán Biến động Thích ứng 📏
Hệ thống đo biến động thị trường bằng hai phương pháp:
- Độ lệch chuẩn (StdDev): Phương pháp đo phân tán cổ điển
- Độ lệch tuyệt đối trung bình (MAD): Mạnh mẽ hơn với các giá trị cực đoan
Biến động được tính toán được làm mượt và sau đó so sánh với lịch sử biến động trước đó để xác định thứ hạng phần trăm. Phần trăm này điều khiển hệ số nhân dải:
- Biến động thấp (phần trăm thấp): Các dải gần giá hơn 🤏
- Biến động cao (phần trăm cao): Các dải rộng hơn, tạo không gian cho biến động 🌐
Tạo tín hiệu 🔔
Tín hiệu được kích hoạt khi giá thực tế vượt qua các dải thích ứng:
- Khi tín hiệu được kích hoạt, chỉ báo duy trì trạng thái xu hướng cho đến khi xảy ra giao cắt ngược lại, ngăn chặn tín hiệu sai trong vùng tích lũy. 🛡️
Nó được sử dụng để làm gì? 🛠️
Xác định xu hướng 👀
Chỉ báo tô màu các cây nến theo hướng của xu hướng được phát hiện, cho phép bạn nhanh chóng nhận biết thị trường đang trong giai đoạn tăng hay giảm. Đám mây màu giữa các đường lọc củng cố trực quan sức mạnh và hướng đi của chuyển động.
Điểm vào và điểm ra ➡️🚪
Tín hiệu MUA/BÁN được đánh dấu bằng các biểu tượng nổi bật chỉ ra những thời điểm tiềm năng để vào hoặc ra khỏi thị trường. Những tín hiệu này nhằm nắm bắt sự khởi đầu của xu hướng khi giá thể hiện đủ động lực để vượt qua các dải thích ứng.
Quản lý vị thế 💼
Các dải trên và dưới đóng vai trò là các mức tham chiếu cho:
- Xác định điểm dừng động
- Xác định vùng quá mua/quá bán tương đối 🏷️
- Đánh giá xem xu hướng có đang mất sức mạnh (giá hồi về đường trung tâm) 📉
Tóm tắt
Key features include visual BUY/SELL signals triggered when price crosses the adaptive bands, candle coloring to indicate bullish or bearish trends, and colored clouds between filtered lines to represent trend strength. The bands also serve as dynamic reference levels for setting stops, identifying overbought or oversold conditions, and assessing trend strength. This indicator supports various markets including Forex, Crypto, Stocks, and symbols such as BTCUSD, EURUSD, GBPUSD, XAUUSD, and USDJPY. It is intended for trend identification, entry and exit timing, and position management within diverse trading environments.


![Logo "[Stellar Strategies] Inside Bar with Signals"](https://cdn.ctrader.com/image/webp/1d9e8bfa-3b2c-4440-bb37-5856902008a7_30683)


