说明
这个算法是一个先进的技术工具 🔧,旨在自动检测 几何价格形态(谐波形态) 和基于 价格行为的市场结构。其主要目标是识别 高概率潜在趋势反转区域 📍。
https://chartshots.spotware.com/c/693330cd99c57
这个算法做什么?
该算法实时扫描图表 实时 🔍,寻找特定的价格形态。它在两个层面上工作:
- 结构映射(ZigZag):首先,它通过绘制 “ZigZag”线 连接相关的高点和低点(枢轴)。它同时使用多达 4种不同长度 📏,以捕捉小(短期)和大(长期)趋势。
- 形态识别:一旦识别出这些枢轴点(点A、B、C、D、X),算法测量它们之间的距离和 比例。如果这些比例符合经典交易形态(如斐波那契)的数学规则,指标将绘制该形态并 提醒用户 🚨。
它的用途是什么?
它用于 消除主观性 在绘制复杂形态时,并 节省分析时间 ⏳。指标自动完成斐波那契回撤和扩展的测量,代替手动操作,以便:
- 检测反转:找到价格可能转向(从看涨转为看跌或反之)的点。 🔄
- 识别入场点:标示精确区域(即 “潜在反转区”)以进入市场。 🎯
- 确认分析:作为您自身支撑/阻力策略的 额外佐证。
计算逻辑
指标核心基于 斐波那契比例和市场对称性 ⚖️。算法对每种形态验证 严格规则。例如,为确认 “Gartley” 形态,算法内部计算:
- 点B相对于XA腿的回撤是否恰好(或非常接近) 0.618。
- 点D的投影是否符合特定比例。
指标允许有一个小的 误差范围(可配置),因为市场很少精确到点。它还在显示形态前计算理论上的 风险/回报比。
它检测的形态:
https://chartshots.spotware.com/c/6933314cb9fa1
- 经典形态:双顶和双底。 🏔️🏞️
- 谐波形态:Gartley、蝙蝠 🦇、蝴蝶 🦋、螃蟹 🦀、深螃蟹、鲨鱼 🦈、Cypher。
- ABCD结构:经典ABCD,AB=CD,扩展ABCD。
- 异形结构:三驱动,5-0。
https://chartshots.spotware.com/c/6933317ae4324
如何使用?
视觉设置:
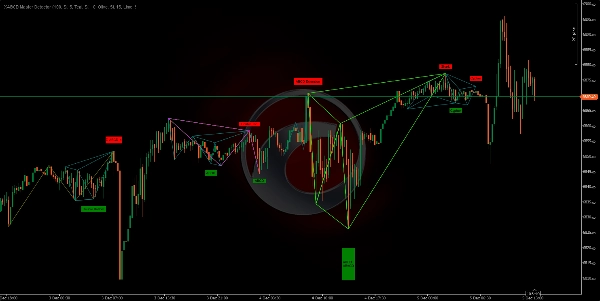
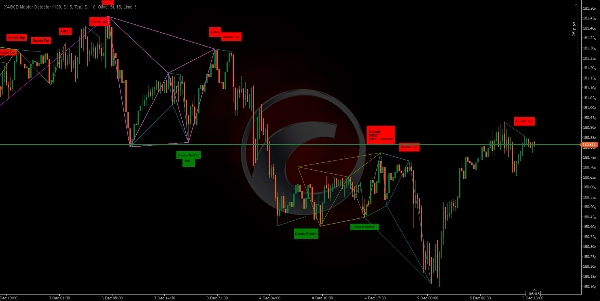
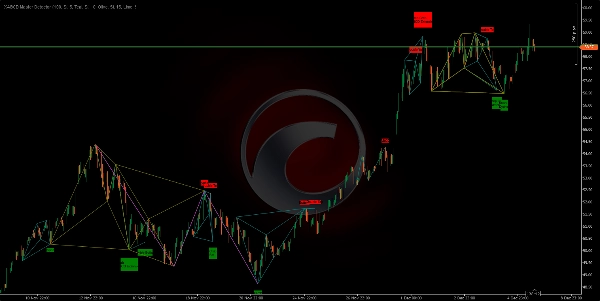
- 您将看到 彩色线条 连接峰谷。
- 当形态完成时,会出现彩色几何图形和一个 带有形态名称的标签(例如,“Gartley”,“双顶”)。
- 绿色标签:表示 看涨形态 (寻找买入)。 📈
- 红色标签:表示 看跌形态 (寻找卖出)。 📉
解读:
- 不要盲目交易每个标签。将其用作 警报信号。
- 当形态出现时, 等待价格在D区反应 (形态的最后一点)。
- 寻找 额外确认 (如日本反转蜡烛或RSI背离)后再入场。
关键调整:
- 您可以 激活或停用特定形态 如果您只喜欢交易某些形态(例如,仅“蝙蝠”和“Gartley”)。 ✅
- 您可以调整 ZigZag的灵敏度 以观察更快的波动或更慢的趋势。 ⚙️
🏆 超过10,000名交易者信赖我们的25+算法套件! 🏆
从 市场结构与流动性 到 智能退出系统与预测工具 — 我们构建了您实现持续盈利所需的所有工具。
👉 访问全部25+经过验证的系统:
_______________________________________________
📌 市场结构指标
· ✅ 高级市场结构:Bos、Choch、SwinLevels、订单区块, 市场结构与流动性发现器
· 🔄动态市场结构转折点分析
· 🧱 订单区块
· ⚖️ 市场失衡
· ⛓️ BOS与CHOCH
· 🧠 ICT三力
· 🌀 市场极性区域
_______________________________________________
🔚 智能退出系统
· 📍 跟踪智能算法
_______________________________________________
📐 ZigZag指标
· 🔍 ZigZag价格流动性投影
· 🧭 支撑阻力结构ZigZag
· ➖ ZigZag
· 🎯 Zig-Zag极端追踪器
_______________________________________________
🧱 支撑与阻力指标
· 🟩 智能趋势支撑与阻力线
· 🧱 所有支撑与阻力水平
_______________________________________________
📊 趋势与通道指标
· 🔄 自动趋势通道
· 📊 超级趋势
· ⚡动量趋势分析器
· 🧠 自适应趋势通道
· 💥 通道突破系统
· 🌈 动态趋势梯度
· ⭐ 高级SSL通道
· 🔁 反应性移动平均线
_______________________________________________
💧 成交量与流动性工具
· 🔥 成交量POC热力图
· 📉 杠杆清算图
· 🔍 动量公平价值缺口
· 🕒 公平价值缺口时段
_______________________________________________
⚡ 动量与RSI指标
· 📈 RSI趋势触发器
· 🚀 动态范围动量
· 🔎 多级蜡烛偏差
追踪器
_______________________________________________
🔮 预测与投影工具
· 📐 基于线性回归和ATR的预测
· 📏 斐波那契线性回归多时间框架
· 📈 成交量驱动的市场流动投影器_________________________
_________________________________________________________________________________________________
_________________________________________________________________________________________________
RSI通道触发器: 📶
它是什么: 一个计算RSI(周期)并在RSI穿越超买/超卖阈值(默认70/30)时,视觉标记动量区域的指标。✅
https://chartshots.spotware.com/c/69278f8b6d973
逻辑: 当穿越发生时,它基于穿越时蜡烛的高/低创建一个“区域”。然后:🧠
- 为该区域内的蜡烛着色。
- 绘制一个通道(高点、低点、中点)。
- 在RSI面板上用圆圈和标签标记穿越点。
该区域持续时间正好为 MinZoneDuration 根K线。⏱️
明确的信号:
- 穿越 超买区以上 → 触发一个 看涨区域。🟢
- 穿越 超卖区以下 → 触发一个 看跌区域。🔴
该区域本身是一个 关注区域,而非订单。
https://chartshots.spotware.com/c/69278fb274e0b
快速使用方法:
- 等待区域形成。🎯
- 用 价格行为确认(突破/拒绝通道线)。
- 在区域外设置 止损,并以中通道线或定义的风险/回报比作为 目标入场。
https://chartshots.spotware.com/c/69278fe76237b
关键参数: ⚙️
- RSI周期(14)
- 超买(70)
- 超卖(30)
- 最小区域持续时间(15)
- 可配置颜色 🎨
摘要
The algorithm recognizes classic and complex patterns—including Double Top/Bottom, Gartley, Bat, Butterfly, Crab, Deep Crab, Shark, Cypher, ABCD structures, and exotic patterns like Three Drives and 5-0—by measuring distances and Fibonacci ratios between pivot points. Upon pattern completion, it visually displays colored geometric figures and labels indicating bullish (green) or bearish (red) signals.
Users can customize pattern detection and ZigZag sensitivity to suit their trading preferences. The indicator supports various markets such as Forex, commodities, indices, stocks, and cryptocurrencies, including symbols like EURUSD, GBPUSD, BTCUSD, XAUUSD, NAS100, and USDJPY.
XABCD Master Detector aims to reduce subjectivity and save analysis time by automatically calculating Fibonacci retracements, extensions, and theoretical risk/reward ratios. It serves as an alert tool to detect reversals, identify entry points, and provide additional confluence to existing support/resistance strategies.
客户评价
5 | 100 % | |
4 | 0 % | |
3 | 0 % | |
2 | 0 % | |
1 | 0 % |


!["[Hamster-Coder] Moving Average MTF" 标识](https://cdn.ctrader.com/image/webp/b11b98b1-194d-4b8e-b00e-d611826ad159_31226)