
Beschreibung
▁▂▃▄▅▆▇ █ 10.000+ Händler (institutionell + privat) █ ▇▆▅▄▃▂▁
- Wählen Sie unsere TOP-Indikatoren in cTrader 🏆
- ✨ Exklusive Präzision für überlegene Ergebnisse ✨
- 📈 Unsere Algorithmen — mit den bestbewerteten Visuals 🎯—
- wurden erfolgreich in 2 Quant-Fonds implementiert
▁▂▃▄▅▆▇ █████████████████████████████ ▇▆▅▄▃▂▁
_______________________________________________
_______________________________________________
📌 Market Structure Indicators
· ✅ AdvancedMarket Structure: Bos, Choch, SwinLevels, Order Blocks, Market Structure& Liquidity Finder
· 🔄 Dynamic Market StructureAnalysis of Turning Points
· 🧱 Order Block
· ⚖️ Market Imbalance
· ⛓️ BOS & CHOCH
· 🧠 ICT Power of 3
______________________________________________________________-
Store cBots : 🧠 Gold & BTC BreakoutSession Pivots 🧠
_______________________________________________
🔚 Smart Exit Systems
_______________________________________________
📐 ZigZag Indicators
· 🔍 ZigZag Price LiquidityProjection
· ➖ ZigZag
_______________________________________________
🧱 Support & Resistance Indicators
· 🟩 SmartTrend Support &Resistance Lines
· 🧱 Alle Unterstützungs- und Widerstandsniveaus
_______________________________________________
📊 Trend & Channel Indicators
· 📊 Supertrend
_______________________________________________
💧 Volume & Liquidity Tools
_______________________________________________
⚡ Momentum & RSI Indicators
· 🔎 Multi-Level Candle BiasTracker
_______________________________________________
🔮 Prediction & Projection Tools
· 📐 Vorhersage basierend auf Linreg& ATR
· 📏 Fibonacci Lineare Regression Multi-Timeframe
· 📈 Volumengetriebener Market Flow Projector
______________________________________________________________________________________________________
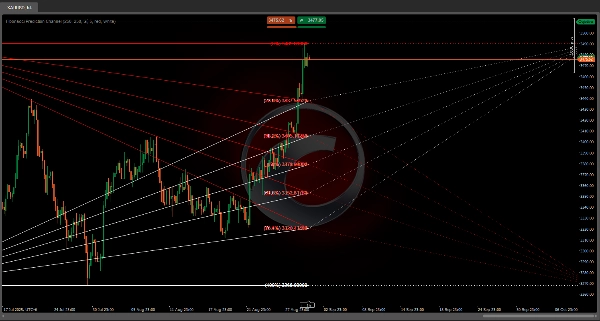
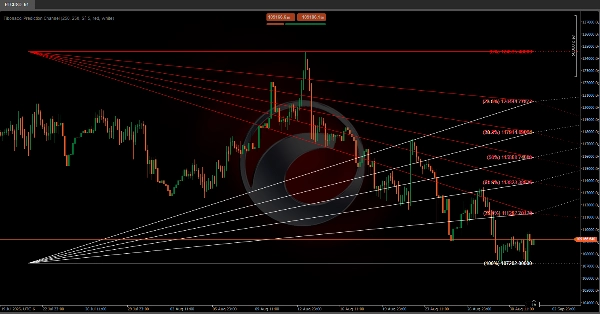
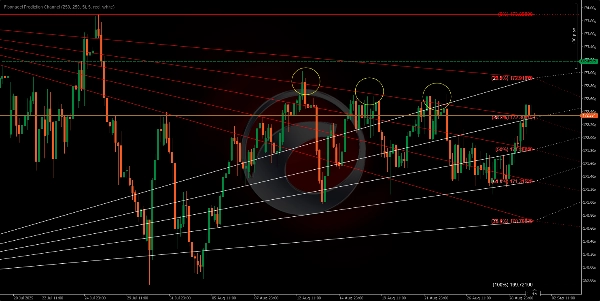
Dieser Algorithmus ist dazu bestimmt, einen zukünftigen Vorhersagekanal basierend auf Fibonacci Retracement-Leveln zu zeichnen 📊✨. Die Fibonacci-Linien erzeugen eine Reihe paralleler Kanäle zwischen jedem Paar aufeinanderfolgender Level. Diese Kanäle können als Bereiche interpretiert werden, innerhalb derer der Preis voraussichtlich schwanken wird 📈📉, wodurch ein visueller Kegel entsteht, mit dem der Preis interagieren wird 🎯. Wenn ein Level durchbrochen wird ⚡, wechseln wir zum nächsten.
Diese Level, die wir in die Zukunft projizieren, fungieren auch als Unterstützung und Widerstand 🛡️⚔️ und erzeugen visuelle Kanäle im Chart, die uns helfen können, Aktionen 🧠✅ zu antizipieren und zu planen, basierend darauf, wie der Preis in der Vergangenheit auf diese Level reagiert hat.
Wir können erwarten, dass der Preis reagiert, wenn er sich diesen Linien nähert 🔍, möglicherweise abprallt innerhalb des Kanals 🔄 oder, wenn genügend Momentum vorhanden ist 🚀, die Linien durchbricht, um in den nächsten Kanal überzugehen.
Die nach rechts ➡️🗓️ projizierten Level basieren nicht auf neuen Preisdaten, sondern auf vergangener Kursentwicklung ⏳. Sie erstrecken sich in die Zukunft als eine Art "Karte" 🗺️ für potenzielle zukünftige Kursreaktionen.
Historische Balken ⏰: Bestimmt, wie viele vergangene Kursperioden bei der Berechnung der Fibonacci-Retracement-Level berücksichtigt werden.


