🚀 10,000+ traders already use our TOP indicators 🏆
Discover why professionals choose us – the most powerful tools on cTrader (indicators, algorithms, and cBots) are waiting for you.
👉 Get all our TOP systems here:
📌 Market Structure Indicators
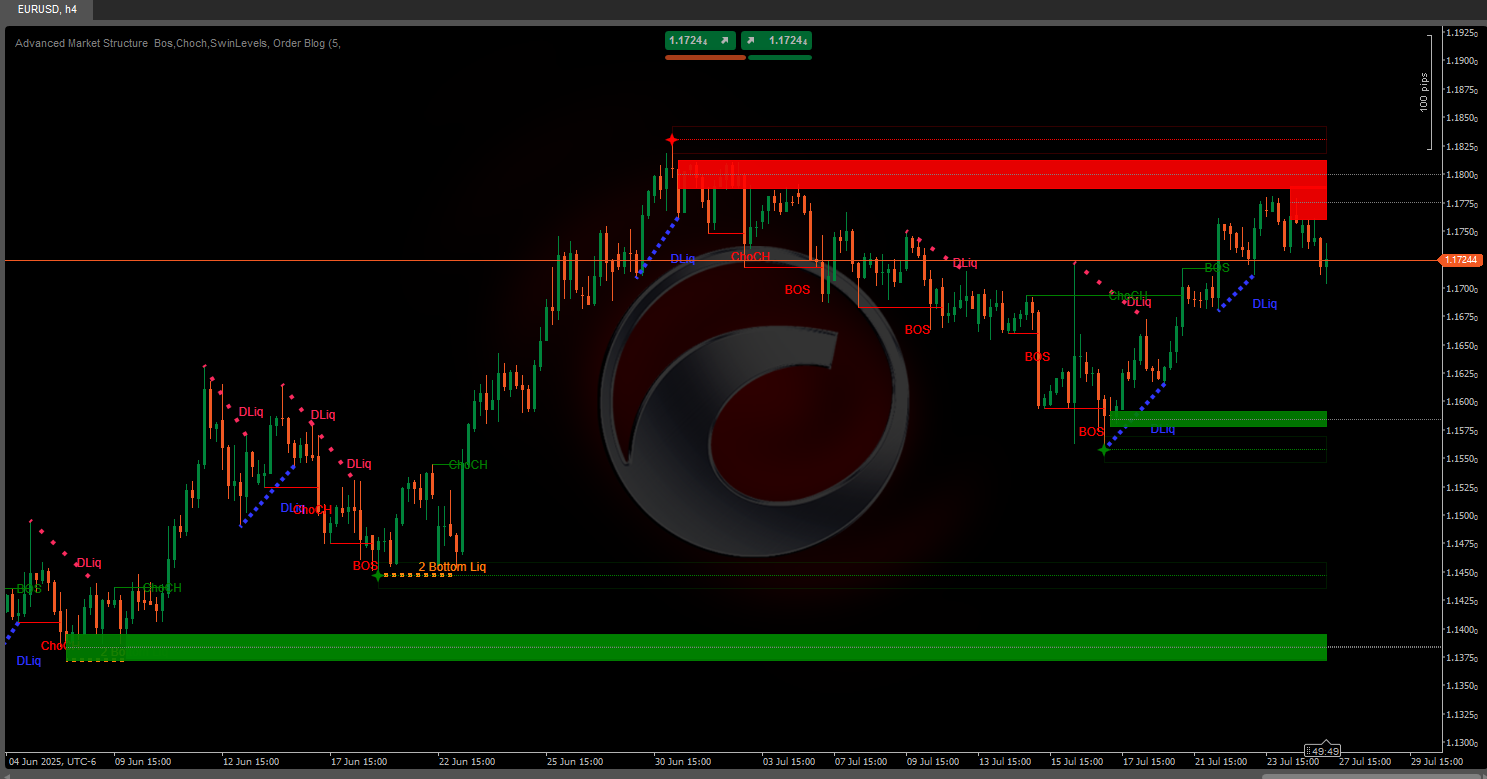
- ✅ Advanced Market Structure: Bos, Choch, SwinLevels, Order Blocks, Market Structure & Liquidity Finder
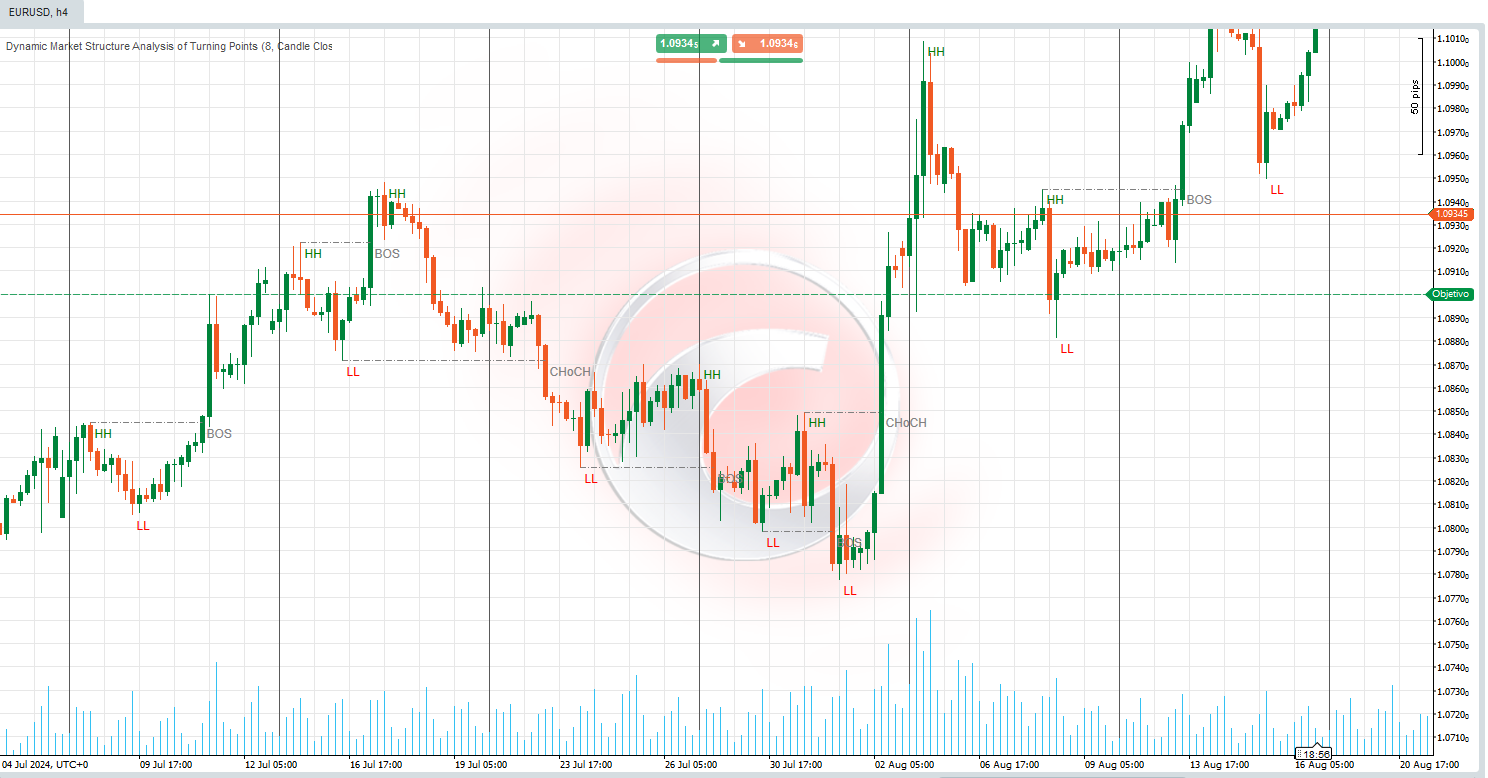
- 🔄 Dynamic Market Structure Analysis of Turning Points
- 🧱 Order Block
- ⚖️ Market Imbalance
- ⛓️ BOS & CHOCH
- 🧠 ICT Power of 3
- 🌀 Market Polarity Zones
🔚 Smart Exit Systems
📐 ZigZag Indicators
🧱 Support & Resistance Indicators
📊 Trend & Channel Indicators
- 🔄 Auto-Trend Channel
- 📊 Supertrend
- 🧠 Adaptive Trend Channel
- 💥 Channel Breakout System
- 🌈 Dynamic Trend Gradient
- ⭐ PREMIUM SSL CHANNEL
- 🔁 Reactive Moving Average
💧 Volume & Liquidity Tools
⚡ Momentum & RSI Indicators
🔮 Prediction & Projection Tools
- 📐 Prediction Based on Linreg & ATR
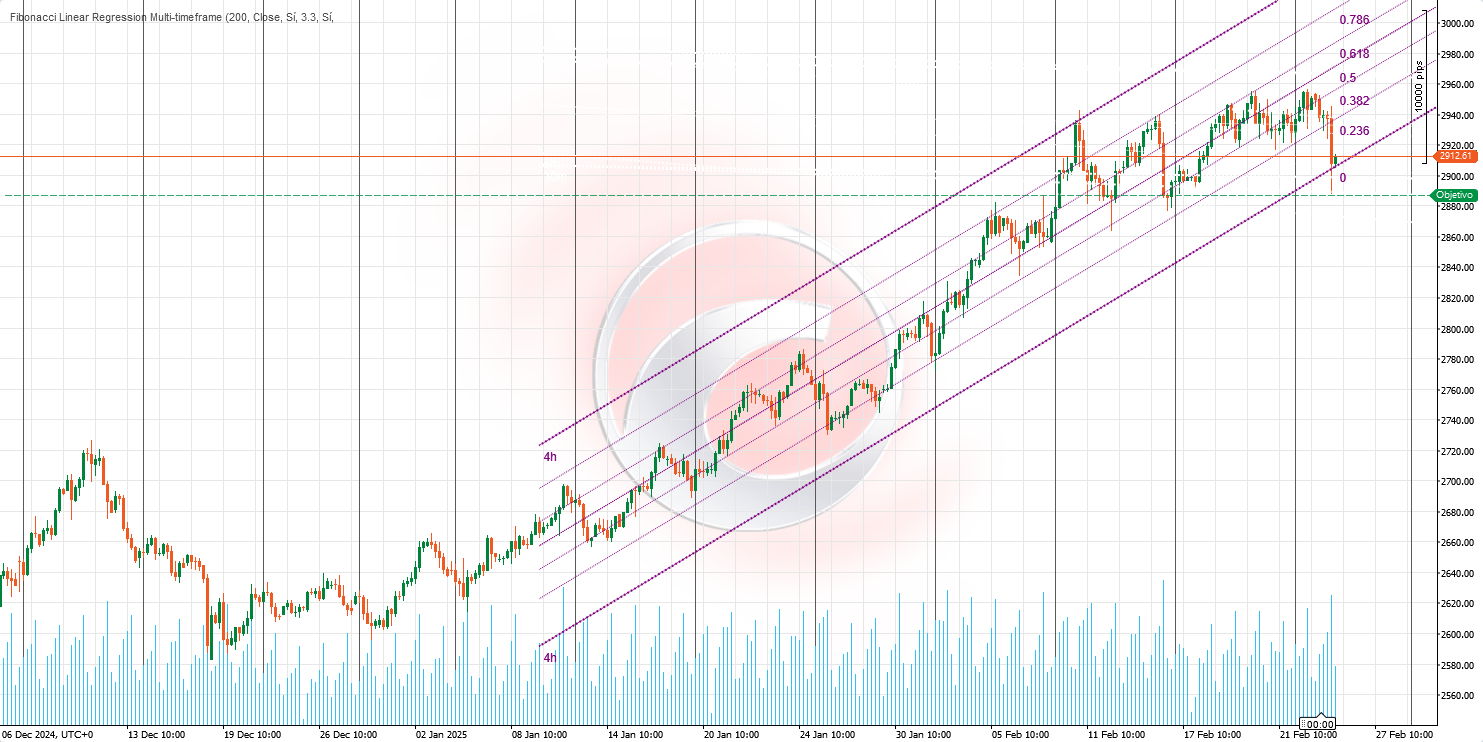
- 📏 Fibonacci Linear Regression Multi-timeframe
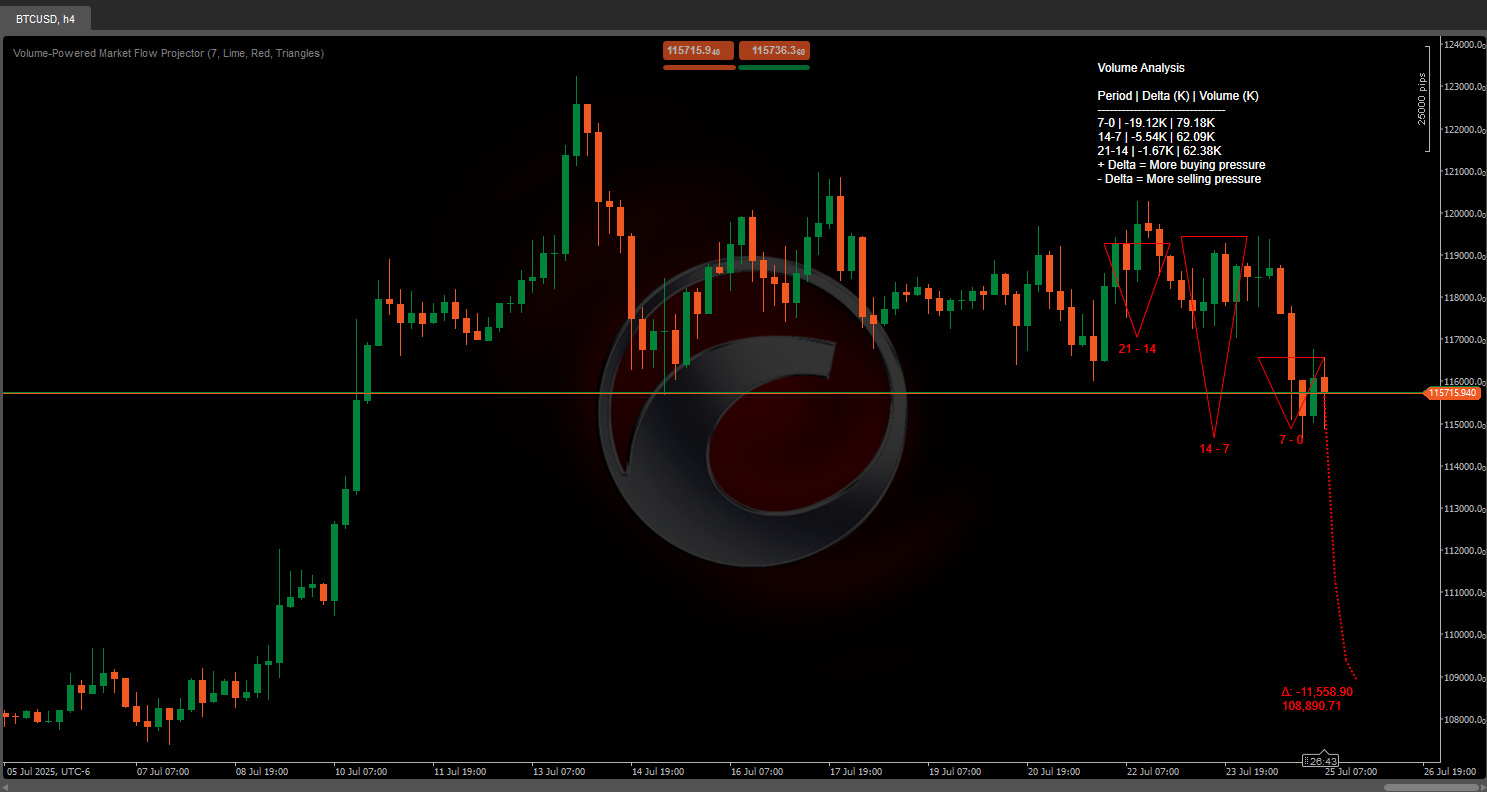
- 📈 Volume-Powered Market Flow Projector
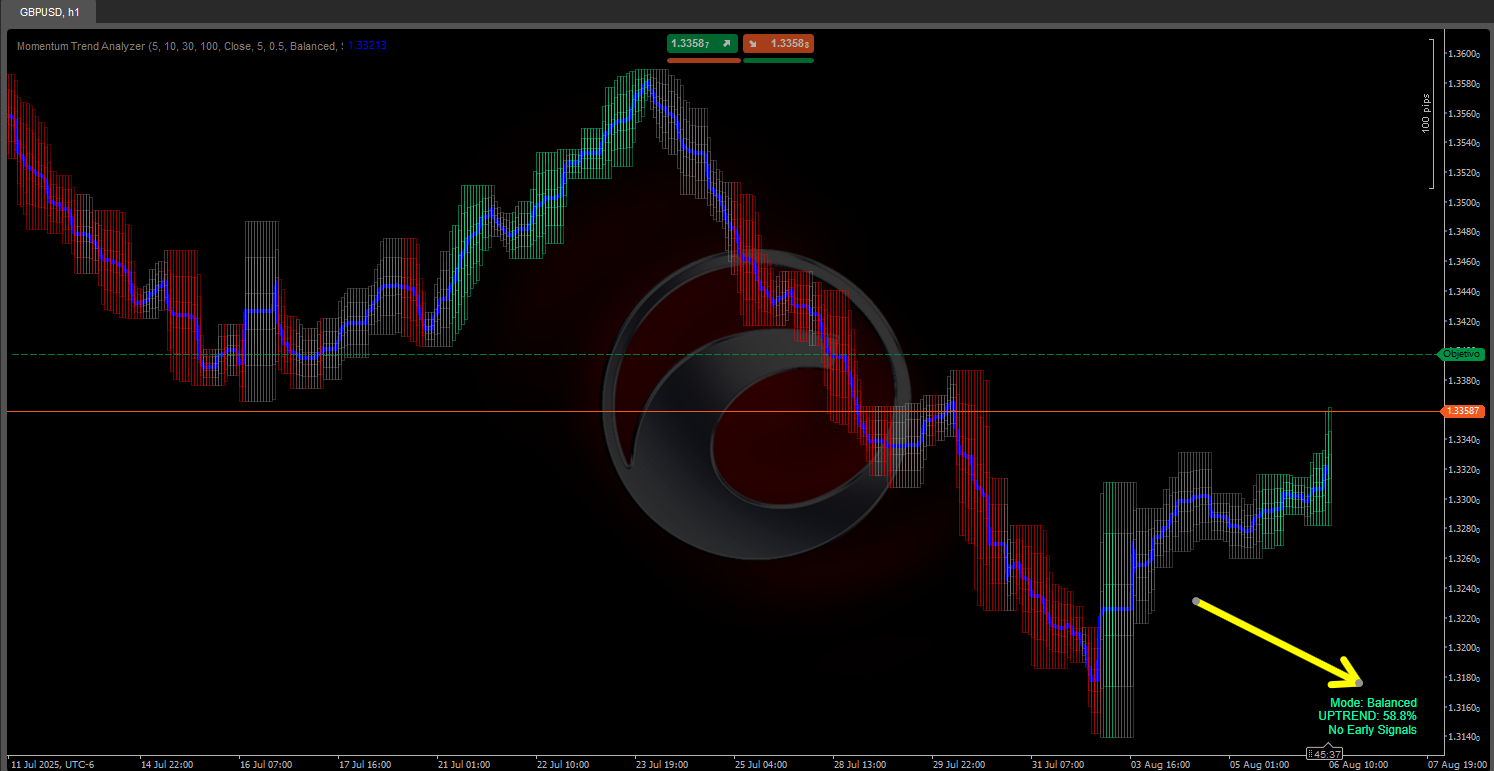
Momentum Trend Analyzer 🚀📊
An advanced technical algorithm designed to identify market trend direction and assess its strength, integrating multiple analytical metrics. This indicator combines exponential moving averages (EMAs), rate of change (RoC), volatility, relative strength, and volume to deliver clear, actionable signals. Below, we break down its functionality and the logic behind its calculations.
Key Components 🔧
The algorithm is built on five core elements working in synergy:
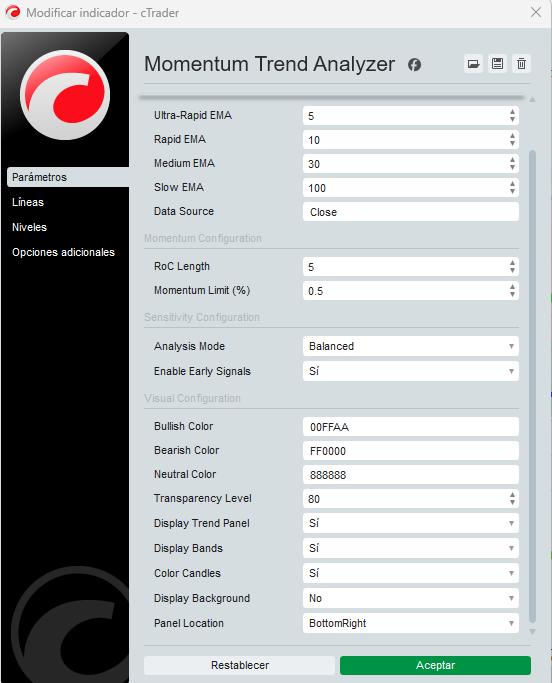
- Exponential Moving Averages (EMA) 📈
- Uses four EMAs with distinct periods: ultra-fast, fast, medium, and slow—typically calculated on closing prices.
- Short-term EMAs (ultra-fast & fast) detect immediate movements, while long-term EMAs (medium & slow) reflect sustained trends.
- Rate of Change (RoC) ⚡
- Measures the percentage price change over a specific period, serving as a direct momentum indicator.
- A smoothed RoC filters minor fluctuations and stabilizes the signal.
- Normalized Average True Range (ATR) 🌪️
- ATR quantifies historical volatility, normalized by dividing it by the current price for relative assessment.
- A high normalized ATR signals increased volatility, affecting trend strength interpretation.
- Relative Strength Index (RSI) 💪
- This oscillator measures the magnitude and speed of price movements, identifying overbought/oversold conditions.
- Helps evaluate momentum intensity within the trend.
- Average Volume 🔊
- A simple moving average of trading volume detects high-activity periods, reinforcing signal validity.
Calculation Logic 🧠
The Momentum Trend Analyzer generates trend and strength signals through a combination of specific conditions and calculations:
1. Trend Determination
- 🟢 Bullish Trend: Confirmed when the fast EMA > medium EMA, medium EMA > slow EMA, and closing price > fast EMA.
- 🔴 Bearish Trend: Confirmed when the fast EMA < medium EMA, medium EMA < slow EMA, and closing price < fast EMA.
- ⚪ Neutral Trend: Occurs when neither condition is met, indicating consolidation or indecision.
2. Early Trend Signals 🔍
- Detects potential trend shifts before full confirmation using:
- Ultra-fast EMA
- Fast EMA slope
- Smoothed RoC
- Example: An early bullish signal triggers if the ultra-fast EMA crosses above the fast EMA, the fast EMA slope is positive, and smoothed RoC exceeds a momentum threshold.
3. Sensitivity Adjustment ⚖️
Three modes available:
- 🛡️ Conservative: Prioritizes confirmed signals, minimizing false positives (slower detection).
- ⚔️ Aggressive: Favors early signals for faster response (higher risk).
- ⚖️ Balanced: A middle-ground approach.
4. Trend Strength Calculation 💯
Strength is derived from a weighted integration of:
- EMA Spread: Distance (%) between fast and slow EMAs.
- RSI Contribution: Difference between RSI and 50 (bullish/bearish).
- Volatility (Normalized ATR): Adjusts strength based on market fluctuations.
- Relative Volume: Strength increases if current volume > average.
- Momentum (Smoothed RoC): Measures movement speed.
- Result: A strength percentage (0%-100%)—higher values = robust trends.
5. Dynamic Bands 🎯
- Three upper/lower bands based on recent price highs/lows.
- Act as dynamic support/resistance levels, adjusting to market volatility.
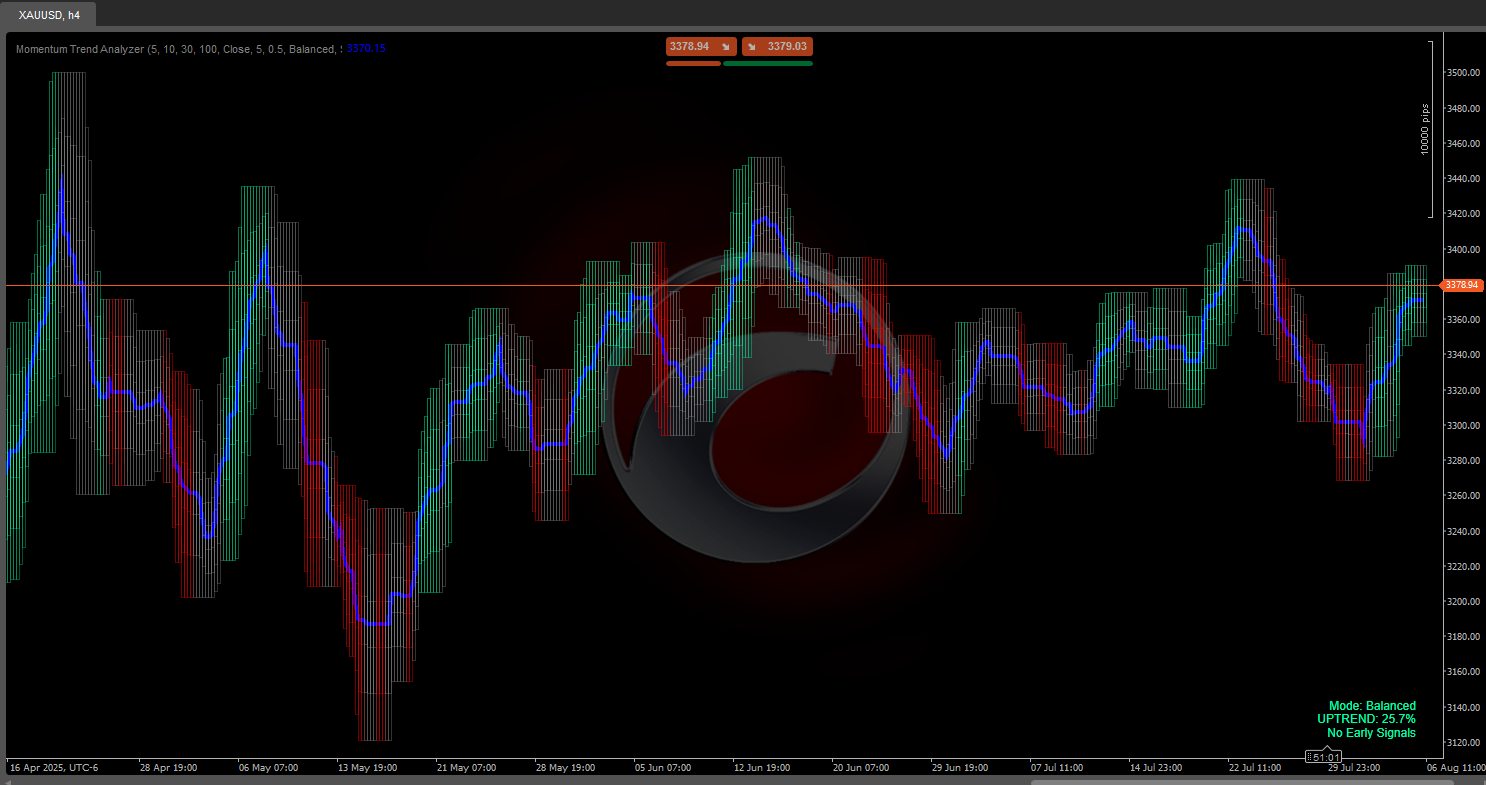
Practical Application for Traders 💼
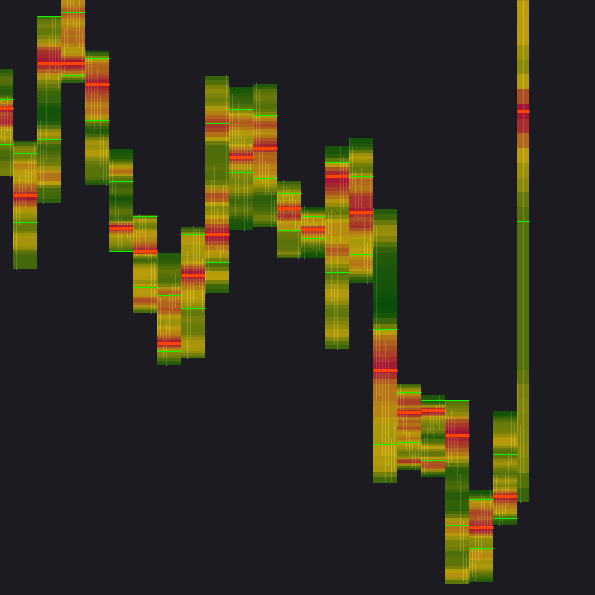
- 📊 Visualization: Trend shown via colored shading (🟢 bullish, 🔴 bearish, ⚪ neutral) + trendline.
- 💪 Strength: Percentage value (e.g., 24.3% = caution; >50% = high confidence).
- 🔄 Band Strategy:
- Bullish: Buy at lower bands, sell at upper bands.
- Bearish: Sell at upper bands, cover at lower bands.
- 🚨 Early Signals: Help aggressive traders anticipate fast-moving markets.
- 🛠️ Flexibility: Sensitivity modes adapt to conservative (wait for confirmation) or aggressive (act early) styles.
Conclusion 🎯
The Momentum Trend Analyzer provides comprehensive trend and momentum analysis by combining EMAs, RoC, normalized ATR, RSI, and volume. Its calculation logic—based on clear conditions and weighted factors—adapts to different risk levels and trading strategies, making it a powerful tool for traders..