Deskripsi
🚀 Lebih dari 10.000 trader sudah menggunakan indikator TOP kami 🏆
Temukan mengapa para profesional memilih kami – alat paling kuat di cTrader (indikator, algoritma, dan cBots) menunggu Anda.
👉 Dapatkan semua sistem TOP kami di sini:
📌 Indikator Struktur Pasar
- ✅ Struktur Pasar Lanjutan: Bos, Choch, SwinLevels, Order Blocks, Market Structure & Liquidity Finder
- 🔄 Analisis Struktur Pasar Dinamis dari Titik Balik
- 🧱 Order Block
- ⚖️ Ketidakseimbangan Pasar
- ⛓️ BOS & CHOCH
- 🧠 ICT Power of 3
- 🌀 Zona Polaritas Pasar
🔚 Sistem Keluar Pintar
📐 Indikator ZigZag
🧱 Indikator Support & Resistance
📊 Indikator Tren & Saluran
- 🔄 Saluran Tren Otomatis
- 📊 Supertrend
- 🧠 Saluran Tren Adaptif
- 💥 Sistem Breakout Saluran
- 🌈 Gradien Tren Dinamis
- ⭐ PREMIUM SSL CHANNEL
- 🔁 Rata-rata Bergerak Reaktif
💧 Alat Volume & Likuiditas
⚡ Indikator Momentum & RSI
🔮 Alat Prediksi & Proyeksi
- 📐 Prediksi Berdasarkan Linreg & ATR
- 📏 Regresi Linear Fibonacci Multi-timeframe
- 📈 Proyektor Aliran Pasar Berbasis Volume
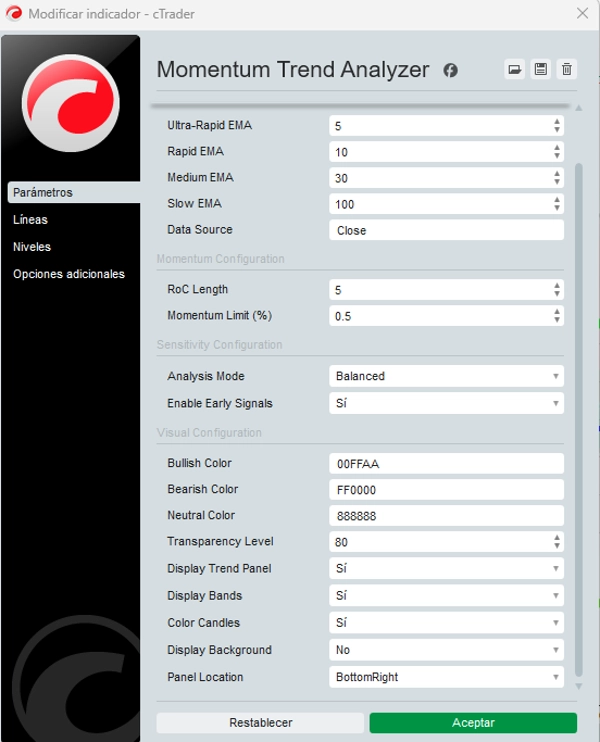
Analisis Tren Momentum 🚀📊
Sebuah algoritma teknis canggih yang dirancang untuk mengidentifikasi arah tren pasar dan menilai kekuatan, mengintegrasikan berbagai metrik analitis. Indikator ini menggabungkan rata-rata bergerak eksponensial (EMA), laju perubahan (RoC), volatilitas, kekuatan relatif, dan volume untuk memberikan sinyal yang jelas dan dapat ditindaklanjuti. Di bawah ini, kami menjelaskan fungsionalitasnya dan logika di balik perhitungannya.
Komponen Utama 🔧
Algoritma ini dibangun berdasarkan lima elemen inti yang bekerja secara sinergis:
- Rata-Rata Bergerak Eksponensial (EMA) 📈
-
- Menggunakan empat EMA dengan periode berbeda: ultra-cepat, cepat, sedang, dan lambat—biasanya dihitung pada harga penutupan.
- EMA jangka pendek (ultra-cepat & cepat) mendeteksi pergerakan segera, sementara EMA jangka panjang (sedang & lambat) mencerminkan tren yang berkelanjutan.
- Laju Perubahan (RoC) ⚡
-
- Mengukur persentase perubahan harga selama periode tertentu, berfungsi sebagai indikator momentum langsung.
- RoC yang diperhalus menyaring fluktuasi kecil dan menstabilkan sinyal.
- Rata-Rata Rentang Nyata Ternormalisasi (ATR) 🌪️
-
- ATR mengukur volatilitas historis, ternormalisasi dengan membaginya dengan harga saat ini untuk penilaian relatif.
- ATR ternormalisasi yang tinggi menandakan volatilitas meningkat, mempengaruhi interpretasi kekuatan tren.
- Indeks Kekuatan Relatif (RSI) 💪
-
- Osilator ini mengukur besaran dan kecepatan pergerakan harga, mengidentifikasi kondisi jenuh beli/jenuh jual.
- Membantu menilai intensitas momentum dalam tren.
- Volume Rata-Rata 🔊
-
- Rata-rata bergerak sederhana dari volume perdagangan mendeteksi periode aktivitas tinggi, memperkuat validitas sinyal.
Logika Perhitungan 🧠
Momentum Trend Analyzer menghasilkan sinyal tren dan kekuatan melalui kombinasi kondisi dan perhitungan spesifik:
1. Penentuan Tren
- 🟢 Tren Bullish: Dikonfirmasi ketika EMA cepat > EMA sedang, EMA sedang > EMA lambat, dan harga penutupan > EMA cepat.
- 🔴 Tren Bearish: Dikonfirmasi ketika EMA cepat < EMA sedang, EMA sedang < EMA lambat, dan harga penutupan < EMA cepat.
- ⚪ Tren Netral: Terjadi ketika tidak ada kondisi yang terpenuhi, menunjukkan konsolidasi atau ketidakpastian.
2. Sinyal Tren Awal 🔍
- Mendeteksi pergeseran tren potensial sebelum konfirmasi penuh menggunakan:
-
- EMA ultra-cepat
- Kemiringan EMA cepat
- RoC yang diperhalus
- Contoh: Sinyal bullish awal terpicu jika EMA ultra-cepat melintasi di atas EMA cepat, kemiringan EMA cepat positif, dan RoC yang diperhalus melebihi ambang momentum.
3. Penyesuaian Sensitivitas ⚖️
Tersedia tiga mode:
- 🛡️ Konservatif: Memprioritaskan sinyal yang dikonfirmasi, meminimalkan positif palsu (deteksi lebih lambat).
- ⚔️ Agresif: Mengutamakan sinyal awal untuk respons lebih cepat (risiko lebih tinggi).
- ⚖️ Seimbang: Pendekatan tengah.
4. Perhitungan Kekuatan Tren 💯
Kekuatan diperoleh dari integrasi berbobot dari:
- Sebaran EMA: Jarak (%) antara EMA cepat dan lambat.
- Kontribusi RSI: Perbedaan antara RSI dan 50 (bullish/bearish).
- Volatilitas (ATR Ternormalisasi): Menyesuaikan kekuatan berdasarkan fluktuasi pasar.
- Volume Relatif: Kekuatan meningkat jika volume saat ini > rata-rata.
- Momentum (RoC yang Diperhalus): Mengukur kecepatan pergerakan.
- Hasil: Sebuah persentase kekuatan (0%-100%)—nilai lebih tinggi = tren yang kuat.
5. Pita Dinamis 🎯
- Tiga pita atas/bawah berdasarkan harga tertinggi/terendah terbaru.
- Berfungsi sebagai level support/resistance dinamis yang menyesuaikan dengan volatilitas pasar.
Aplikasi Praktis untuk Trader 💼
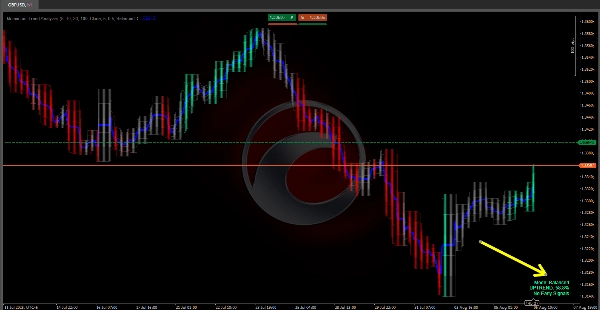
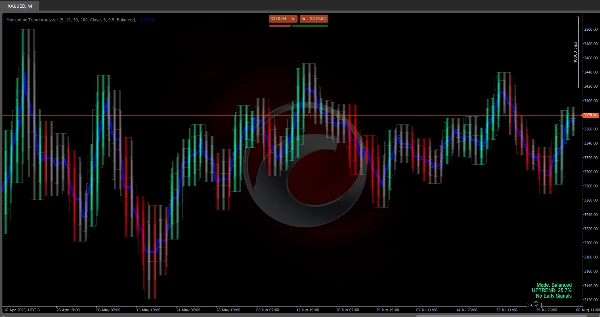
- 📊 Visualisasi: Tren ditampilkan melalui bayangan berwarna (🟢 bullish, 🔴 bearish, ⚪ netral) + garis tren.
- 💪 Kekuatan: Nilai persentase (misal, 24,3% = hati-hati; >50% = kepercayaan tinggi).
- 🔄 Strategi Pita:
-
- Bullish: Beli di pita bawah, jual di pita atas.
- Bearish: Jual di pita atas, tutup posisi di pita bawah.
- 🚨 Sinyal Awal: Membantu trader agresif mengantisipasi pasar yang bergerak cepat.
- 🛠️ Fleksibilitas: Mode sensitivitas menyesuaikan dengan konservatif (menunggu konfirmasi) atau agresif (bertindak lebih awal) gaya.
Kesimpulan 🎯
Momentum Trend Analyzer menyediakan analisis tren dan momentum yang komprehensif dengan menggabungkan EMA, RoC, ATR ternormalisasi, RSI, dan volume. Logika perhitungannya—berdasarkan kondisi jelas dan faktor berbobot—menyesuaikan dengan berbagai tingkat risiko dan strategi perdagangan, menjadikannya alat yang kuat bagi para trader..
Ringkasan
The indicator determines bullish, bearish, or neutral trends based on EMA relationships and price positioning. It provides early trend shift signals using ultra-fast EMA, fast EMA slope, and smoothed RoC. Users can select from three sensitivity modes—conservative, balanced, and aggressive—to adjust signal responsiveness according to their trading style.
Trend strength is calculated as a weighted integration of EMA spread, RSI deviation from neutral, normalized volatility, relative volume, and momentum, expressed as a percentage from 0% to 100%. The indicator also features dynamic bands derived from recent price highs and lows, serving as adaptive support and resistance levels.
Visualization includes colored shading to indicate trend direction and a trendline, with strength values aiding decision-making. The band strategy suggests buying near lower bands and selling near upper bands in bullish trends, and the reverse in bearish trends. This tool supports diverse risk levels and trading strategies by providing comprehensive trend and momentum analysis.