
Beschreibung
Effizienzbasierter gleitender Durchschnitt, der die Glättungsgeschwindigkeit dynamisch an die Marktbedingungen anpasst.
Berechnet die Glättung über das Effizienzverhältnis (gerichtete Bewegung vs. Gesamtvolatilität), reagiert schnell bei Trends und flacht bei Rauschen ab, um Fehlsignale zu vermeiden.
Dreistufige Farbvisualisierung (Grün Aufwärtstrend, Rot Abwärtstrend, Hellblau Seitwärtsbewegung), konfigurierbare Sensitivitätsparameter (Periode, schnelle/langsame Glättung, ER-Schwelle), automatischer Wechsel zwischen schnellen und langsamen Modi sowie dynamisches Unterstützungs-/Widerstandsverhalten bieten eine adaptive Trendverfolgung für Trader, die in richtungsgebundenen Märkten Reaktionsfähigkeit und in Konsolidierungsphasen Stabilität benötigen.
EIGENSCHAFTEN
Adaptiver Algorithmus
- Die Glättungsgeschwindigkeit ändert sich basierend auf dem Effizienzverhältnis (ER) – dem Verhältnis von gerichteter Bewegung zur Gesamtvolatilität
- Reagiert schnell, wenn die Effizienz steigt
- Flacht ab, wenn der Preis volatil ist, um Fehlsignale zu vermeiden
- Dynamische Distanz zum Preis basierend auf dem Marktverhalten
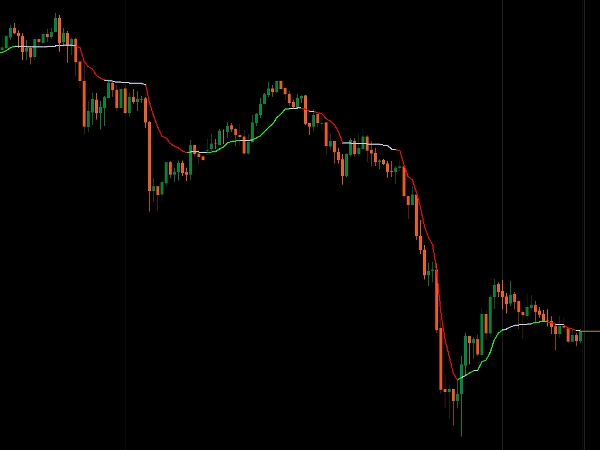
Dreistufige Visualisierung
- Grün: Starker Aufwärtstrend (ER über Schwelle + steigend)
- Rot: Starker Abwärtstrend (ER über Schwelle + fallend)
- Hellblau: Seitwärtsbewegung/volatil (ER unter Schwelle)
- Sofortige visuelle Bestätigung der Marktbedingungen
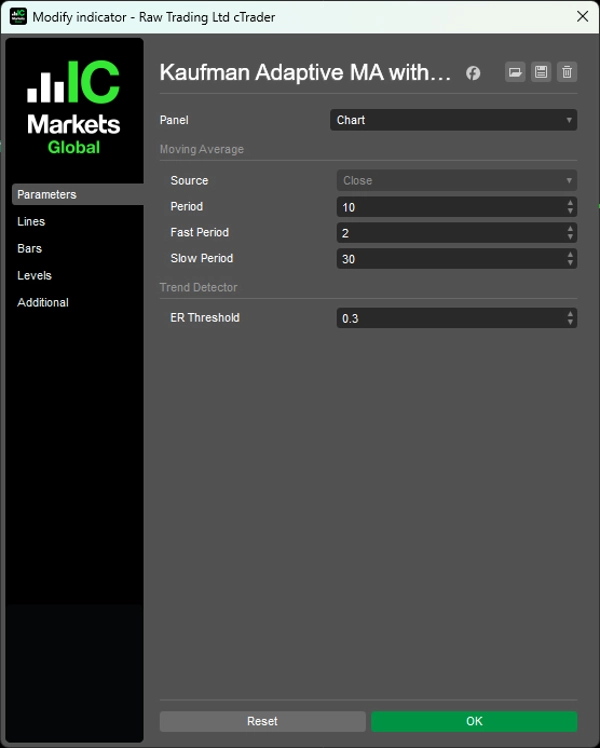
Konfigurierbare Sensitivität
- Periode: Rückblick für Effizienzberechnung (Standard: 10)
- Schnelle Periode: Glättung bei starken Trends (Standard: 2)
- Langsame Periode: Glättung bei Seitwärtsmärkten (Standard: 30)
- ER-Schwelle: Minimale Effizienz, um als Trend zu gelten (Standard: 0,3)
Intelligente Anpassung
- Wechselt automatisch zwischen schneller und langsamer Glättung
- Filtert Rauschen in volatilen Märkten
- Erkennt Trends frühzeitig bei sich ändernden Bedingungen
- Funktioniert als dynamische Unterstützung/Widerstand
__________________________________________________________________________________________
MEHR KOSTENLOSE INDIKATOREN
Entdecken Sie eine breite Palette von Marktanalysetools – von Struktur und Volumen bis hin zu Regression, Volatilität und benutzerdefinierten Zeitrahmen.
Der Quellcode ist im GitHub Repository verfügbar.
Alle kostenlos nutzbar. Wenn Sie jedoch eine Kaffeespende senden möchten, können Sie dies hier tun.
Unterstützung/Widerstand
Volumen
- Volumenaktivitätsprofiler
- Volumeneffizienzanalyse
- Volumenprofil-Analytik
- Volumenprofil - Aktualisiert
- Volumenausbreitungsanalyse
- VWAP (Volumen-gewichteter Durchschnittspreis)
Gleitende Durchschnitte
- SSL-Kanal
- Verankerter gleitender Durchschnitt
- Abweichungsskaliertes gleitendes Mittel
- Gann High Low Aktivator
- Sofortige Trendlinie
- Kaufman Adaptive MA mit Trend Vision
- Gleitender Durchschnittskanal
- Gleitende Durchschnitte Suite
- Trendkanal gleitender Durchschnitt
Dienstprogramme/Benutzerdefiniert
Regressionsbasiert
Volatilität
Oszillatoren
__________________________________________________________________________________________
HAFTUNGSAUSSCHLUSS
Der Handel birgt Risiken. Dieser Indikator ist nur für die technische Analyse gedacht – wenden Sie stets ein angemessenes Risikomanagement an und handeln Sie verantwortungsbewusst.
FEEDBACK & VERBESSERUNGEN
Wenn Sie Vorschläge, Funktionswünsche oder Ideen zur Verbesserung haben, hinterlassen Sie bitte einen Kommentar im Diskussions-Tab. Ihr Feedback hilft, den Indikator für alle zu verbessern.
Zusammenfassung
Key features include a three-state color-coded visualization: green for strong uptrends, red for strong downtrends, and light blue for ranging or choppy markets, providing immediate visual insight into market states. Users can configure sensitivity parameters such as lookback period, fast and slow smoothing periods, and the ER threshold to tailor responsiveness.
The indicator automatically switches between fast and slow smoothing modes, adapting to changing market behavior. It also acts as a dynamic support and resistance tool, helping traders identify trend shifts early while filtering out noise in consolidation phases. This adaptive approach supports scalping and other trading strategies requiring both responsiveness and stability in directional and ranging markets.


