
説明
🚀 10,000人以上のトレーダーがすでに当社のTOPインジケーターを使用しています🏆
なぜプロが私たちを選ぶのかを発見してください – 最も強力なツールが cTrader(インジケーター、アルゴリズム、cBots)であなたを待っています。
👉 すべてのTOPシステムはこちらから入手できます:
_______________________________________________
_______________________________________________
📌 マーケット構造インジケーター
· ✅ AdvancedMarket Structure: Bos, Choch, SwinLevels, Order Blocks, Market Structure&流動性ファインダー
· 🧱 オーダーブロック
· ⚖️ マーケットアンバランス
· ⛓️ BOS&CHOCH
· 🧠 ICTパワーオブ3
· 🌀 マーケットポラリティゾーン
______________________________________________________________-
ストアcBots : 🧠 ゴールド&BTCブレイクアウトセッションピボット 🧠
_______________________________________________
🔚 スマートエグジットシステム
· 📍 トレーリングスマートアルゴリズム
_______________________________________________
📐 ジグザグインジケーター
· 🔍 ジグザグ価格流動性予測
· 🧭 S&R構造的ジグザグ
· ➖ ジグザグ
· 🎯 ジグザグ極端トラッカー
_______________________________________________
🧱 サポート&レジスタンスインジケーター
_______________________________________________
📊 トレンド&チャネルインジケーター
· 🔄 オートトレンドチャネル
· 📊スーパートレンド
· 🧠 アダプティブトレンドチャネル
· 💥 チャネルブレイクアウトシステム
· ⭐ プレミアムSSLチャネル
· 🔁 リアクティブ移動平均
_______________________________________________
💧 ボリューム&流動性ツール
· 🔥 ボリュームPOCヒートマップ
· 📉 レバレッジ清算マップ
· 🔍 モメンタムフェアバリューギャップ
· 🕒 フェアバリューギャップセッション
_______________________________________________
⚡ モメンタム&RSIインジケーター
· 📈 RSIトレンドトリガー
· 🚀 ダイナミックレンジモメンタム
_______________________________________________
🔮 予測&投影ツール
· 📐 Linreg&ATRに基づく予測
_________________________________________________________________________________
_________________________________________________________________________________
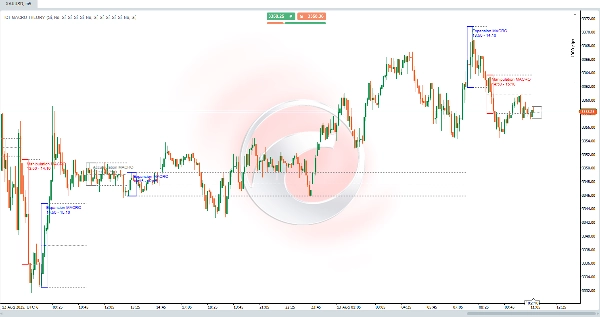
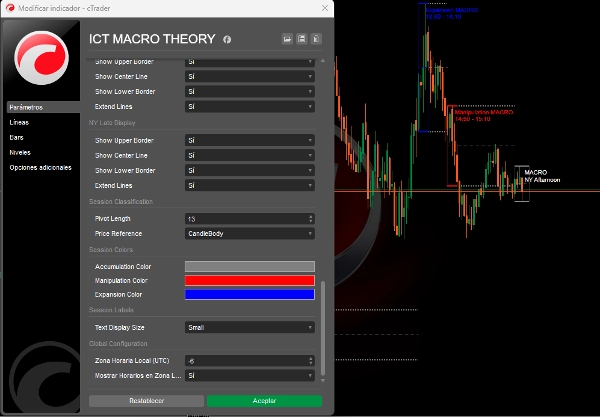
🌐 ICTマクロ理論
⚠️ 重要な注意事項: このインジケーターは 5分未満の時間枠でのみ機能します。
ICTマクロ期間の説明
ICTマクロ期間は本質的に、アルゴリズムが流動性を探したり、公正価値ギャップのために価格を調整したりする短い間隔です。これらのICTマクロの基礎はICTの時間と価格理論にあります。
マクロとは 「価格配信にイベントを作り出す短い一連の指示」とICT自身によって定義されています。
ICTマクロは完全な取引戦略ではありませんが、取引に合流点を加え、利益を最大化できます。これらはロンドン、ニューヨーク、正午、午後のセッション中に発生します。
🔮 ICTマクロ時間理論の高度な実装:
ICTコンセプトへの直接接続:
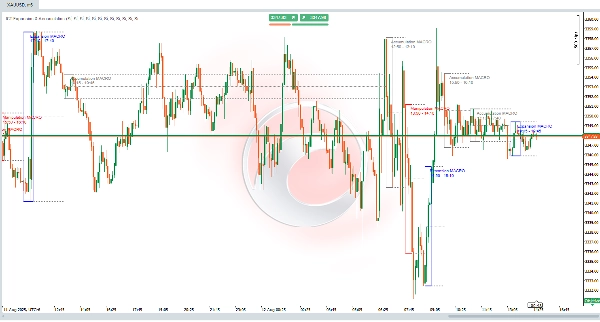
コードは理論で説明されている3種類のICTマクロを正確に実装し、以下に基づく分類ロジックを使用しています:
- マーケット構造分析:
-
- マクロセッションの検出
- 正確なICT時間を記録(ロンドン02:33、NY09:50など)。
- 各マクロセッションの前後で構造変化を検出。
- 自動的に以下に分類:
-
- 🟥 操作:価格が両側(買い/売り)の流動性を掃くとき。
- 🟦 拡張:一方の流動性を取る方向性の動き(トレンドに沿った)。
- 🟩 蓄積:価格が流動性を「蓄積」する狭いレンジ。
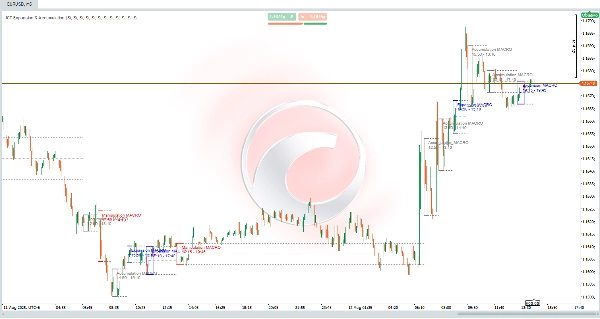
- 拡張された重要レベル:
-
- 各マクロセッションの高値/安値を描画。
- 平均価格(中点)を計算し、次のセッションまで延長。
- これらのレベルは動的なサポート/レジスタンスとして機能(ICTで重要!)。
- リアルタイム流動性検出:
-
- 1分データを使用して正確なピボットを特定(低時間枠で見られるものと同じ)。
今後の強化&アップデート:
- 流動性スイープ検出:過去の流動性スイープ(前日/週の高値/安値)を特定します。
- フェアバリューギャップ(FVG):フェアバリューギャップを検出し、視覚化します。
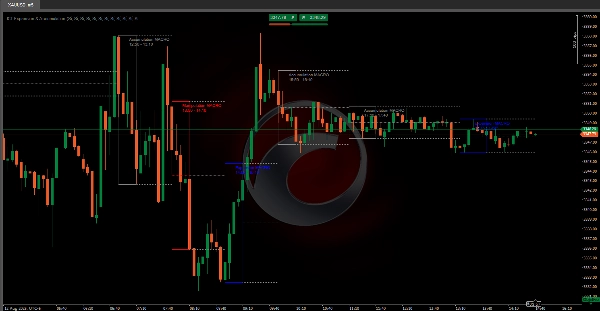
📊 実践的なICT例
NYオープニングシナリオ(09:50-10:10):
- プレセッション:価格が買い側の流動性を掃く(ローカルロー)。
- セッション中:
-
- 🟥 操作として分類されます。
- 価格はベアリッシュ構造にシフトします。
- ポストセッション:
-
- 拡張されたラインはセッション高値でのレジスタンスを示します。
- RR 1:3のゾーンでのトレード拒否。
✅ ICT原則に忠実:
「マクロは完全な戦略ではありませんが、アルゴリズムが流動性を探す場所を特定することで合流点を加えます。」
概要
The indicator analyzes market structure and detects key macro sessions—London, New York, midday, and afternoon—recording exact ICT times. It classifies price behavior into three types of macros: Manipulation (price sweeps liquidity on both sides), Expansion (directional movement aligned with trend), and Accumulation (tight range where price accumulates liquidity). It also draws and extends session highs, lows, and average price levels to act as dynamic support and resistance.
Using 1-minute data, ICT MACRO THEORY detects precise pivots for real-time liquidity identification. While not a complete trading strategy, it adds confluence to trades by highlighting where algorithms seek liquidity. Planned updates include detection of liquidity sweeps and visualization of fair value gaps.
This tool is intended for traders seeking to incorporate ICT macro time concepts into their analysis for enhanced market structure insight and liquidity detection on very short timeframes.


