Mô tả
🚀 Hơn 10.000 nhà giao dịch đã sử dụng các chỉ báo hàng đầu của chúng tôi 🏆
👉 Nhận tất cả các hệ thống hàng đầu của chúng tôi tại đây:
_______________________________________________
📌 Chỉ báo Cấu trúc Thị trường
· ✅ AdvancedMarket Structure: Bos, Choch, SwinLevels, Order Blocks, Market Structure& Liquidity Finder
· 🔄 Phân tích Cấu trúc Thị trường Động của các Điểm Quay
· 🧱 Order Block
· ⛓️ BOS & CHOCH
· 🧠 ICT Power of 3
_______________________________________________
🔚 Hệ Thống Thoát Thông Minh
· 📍 Thuật Toán Thông Minh Theo Sau
_______________________________________________
📐 Chỉ báo ZigZag
· 🔍 Dự Báo Thanh Khoản Giá ZigZag
· 🧭 ZigZag Cấu Trúc Hỗ Trợ & Kháng Cự
· ➖ ZigZag
· 🎯 Bộ Theo Dõi Cực Đoạn Zig-Zag
_______________________________________________
🧱 Chỉ báo Hỗ Trợ & Kháng Cự
· 🟩 Đường Hỗ Trợ & Kháng Cự SmartTrend
· 🧱 Tất Cả Các Mức Hỗ Trợ và Kháng Cự
_______________________________________________
📊 Chỉ báo Xu Hướng & Kênh
· 📊 Supertrend
· ⚡Bộ Phân Tích Xu Hướng Động Lực
· ⭐ KÊNH SSL CAO CẤP
_______________________________________________
💧 Công Cụ Khối Lượng & Thanh Khoản
· 🔥 Bản Đồ Nhiệt POC Khối Lượng
· 🔍 Khoảng Cách Giá Trị Công Bằng Động Lực
· 🕒 Phiên Khoảng Cách Giá Trị Công Bằng
_______________________________________________
⚡ Chỉ báo Động Lực & RSI
· 🔎 Bộ Theo Dõi Định Hướng Nến Đa Cấp
Tracker
_______________________________________________
🔮 Công Cụ Dự Đoán & Dự Báo
· 📐 Dự Đoán Dựa Trên Linreg& ATR
· 📏 Hồi Quy Tuyến Tính Fibonacci Đa Khung Thời Gian
· 📈 Máy Chiếu Dòng Chảy Thị Trường Dựa Trên Khối Lượng
Cung và Cầu Tự Động: 💹
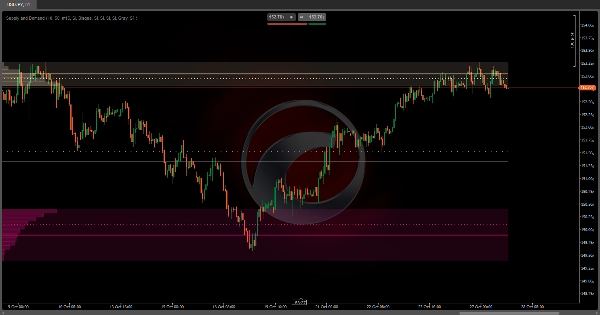
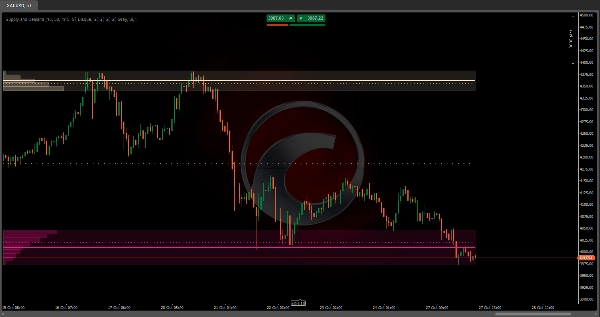
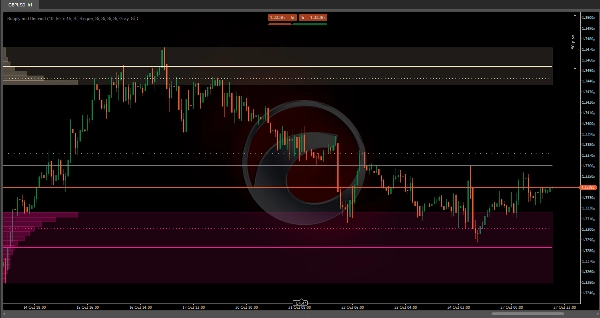
Cung và Cầu Tự Động là một chỉ báo phân tích khối lượng nâng cao tự động xác định các vùng có hoạt động giao dịch cao nhất trên biểu đồ của bạn. 📊 Khác với các chỉ báo tĩnh khác, chỉ báo này điều chỉnh động theo phạm vi quan sát của bạn, tính toán lại các vùng mỗi khi bạn phóng to hoặc cuộn qua biểu đồ.
Nó hoạt động như thế nào? ❓
Thuật toán chia phạm vi giá hiển thị thành nhiều mức ngang (có thể cấu hình từ 2 đến 500 phân đoạn) và phân tích khối lượng giao dịch ở mỗi mức. Để đạt độ chính xác cao hơn, nó sử dụng dữ liệu từ khung thời gian thấp hơn so với khung bạn đang quan sát. 🕒 Ví dụ, nếu bạn đang xem biểu đồ 1 giờ, nó có thể phân tích nến 15 phút để phát hiện chi tiết hơn nơi khối lượng thực sự tập trung.
Quá Trình Xác Định 🔍
Chỉ báo hoạt động từ các cực về phía trung tâm:
- Từ giá cao nhất: 🚀 Nó bắt đầu từ đỉnh của phạm vi hiển thị và đi xuống từng mức, tích lũy khối lượng giao dịch ở mỗi dải giá.
- Từ giá thấp nhất: 📉 Đồng thời, nó đi lên từ đáy, tích lũy khối lượng theo hướng lên trên.
- Ngưỡng kích hoạt: ⚡ Khi bất kỳ vùng nào tích lũy một tỷ lệ phần trăm cụ thể của tổng khối lượng (có thể cấu hình, mặc định 10%), vùng đó được đánh dấu là vùng quan trọng và việc tìm kiếm theo hướng đó dừng lại.
- Vùng giữa: ⚖️ Khi cả hai vùng (trên và dưới) được xác định, khoảng không gian trung gian được đánh dấu là vùng trung lập hoặc cân bằng.
Nó dùng để làm gì? 🎯
Chỉ báo này là công cụ phân tích cấu trúc thị trường giúp bạn:
- Xác định vùng cung: 🏔️ Các khu vực trên nơi có hoạt động bán ra cao trong lịch sử.
- Xác định vùng cầu: 🏖️ Các khu vực dưới nơi hoạt động mua tập trung.
- Phát hiện vùng cân bằng: 🎭 Khoảng giữa nơi áp lực mua và bán cân bằng nhau.
Những vùng này có xu hướng hoạt động như nam châm hút giá trong tương lai, vì chúng đại diện cho các mức mà nhiều người tham gia đã đặt vị thế. 🧲
Nó có thể kết hợp như thế nào? 🔗
Với các chiến lược hành động giá:
- Chờ kiểm tra lại các vùng đã xác định để tìm xác nhận đảo chiều.
- Sử dụng các vùng làm mục tiêu chốt lời hoặc đặt điểm dừng lỗ.
Với các chỉ báo xu hướng:
- Trong xu hướng tăng, tìm điểm vào khi giá kiểm tra lại vùng cầu phía dưới. 📈
- Trong xu hướng giảm, sử dụng vùng cung phía trên làm kháng cự cho các lệnh bán. 📉
Với phân tích đa khung thời gian:
- Xác định vùng trên khung thời gian cao hơn và tìm xác nhận trên các khung thời gian thấp hơn.
- Các vùng từ khung thời gian cao hơn có thể chứa nhiều vùng trên các khung thời gian thấp hơn.
Với các chỉ báo động lực:
- Kết hợp với RSI hoặc Stochastic để xác nhận các điều kiện mua quá mức/bán quá mức trong các vùng.
- Phân kỳ trong các vùng cung/cầu có thể báo hiệu các đảo chiều tiềm năng.
Cấu hình Tùy chỉnh ⚙️
Chỉ báo cho phép bạn điều chỉnh hoàn toàn từng vùng một cách độc lập:
- Kích hoạt/tắt từng phần tử hiển thị (vùng, đường trung bình, đường trọng số).
- Ngưỡng khối lượng: Tỷ lệ phần trăm của tổng khối lượng cần tích lũy để xem một vùng là quan trọng.
- Phân đoạn giá: Số lượng cao hơn = độ chính xác lớn hơn nhưng tính toán nhiều hơn.
- Khung thời gian thấp hơn: Xác định độ chi tiết của phân tích khối lượng.
Tính Năng Chính: Tự Động Thích Ứng 🔄
Tự động tính toán lại dựa trên phạm vi quan sát của bạn. Điều này có nghĩa là:
- Nếu bạn phóng to để xem chi tiết của một phiên, nó sẽ xác định các vùng cung và cầu cụ thể cho những giờ đó.
- Nếu bạn thu nhỏ để xem tuần hoặc tháng, nó sẽ tính toán lại các vùng vĩ mô cho toàn bộ khoảng thời gian.
- Mỗi khi bạn cuộn qua biểu đồ, các vùng sẽ được cập nhật để phản ánh bối cảnh của phạm vi hiển thị.
Tóm tắt
The indicator divides the visible price range into configurable horizontal levels (2 to 500 divisions) and analyzes volume traded at each level using data from a lower timeframe than the chart’s timeframe for enhanced accuracy. It identifies significant zones by accumulating volume from the highest and lowest visible prices until a configurable volume threshold (default 10%) is reached, marking these as supply and demand zones respectively. The area between these zones is designated as a balance zone, representing equilibrium between buying and selling pressures.
These zones highlight areas of historically high trading activity that often act as future price magnets. The indicator supports customization of visual elements, volume thresholds, price divisions, and analysis timeframe. It can be combined with price action strategies, trend indicators, multiple timeframe analysis, and momentum indicators like RSI or Stochastic to improve trade entries, exits, and confirmations.
Supported markets include Forex, Indices, Commodities, Stocks, and Cryptocurrencies, with symbols such as EURUSD, GBPUSD, BTCUSD, XAUUSD, and NAS100.
Đánh giá của khách hàng
5 | 50 % | |
4 | 0 % | |
3 | 0 % | |
2 | 0 % | |
1 | 50 % |


![Logo "[Hamster-Coder] Price"](https://cdn.ctrader.com/image/webp/893fb641-d5b3-44d8-91fb-6a2dc6f3d309_30647)