
说明
Pinescriptlabs 商店指标: Pinescriptlabs 商店 cBots : (cBot) Gold & BTC 突破会话枢轴(新)
高级市场结构:Bos、Choch、SwinLevels、订单区块, 市场结构与流动性发现器(新)
智能追踪算法 (新)
🌟 团队为开发此 Ctrader 指标付出了巨大努力! 通过分享支持我们 - 视觉改进包括水平滚动即将推出!
⚠️ 技术说明: 当前需要手动缩放/滚动以获得最佳观看效果 (“临时限制:由于 Ctrader 平台视觉限制,最佳效果在 1 小时以下时间框架”)
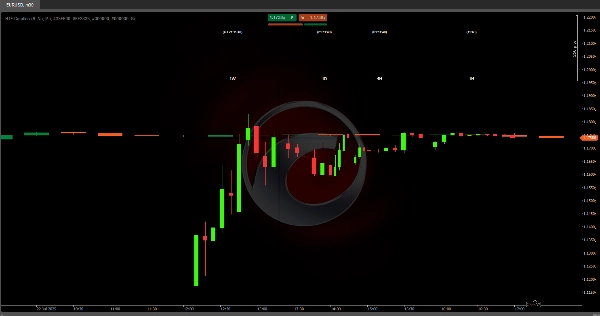
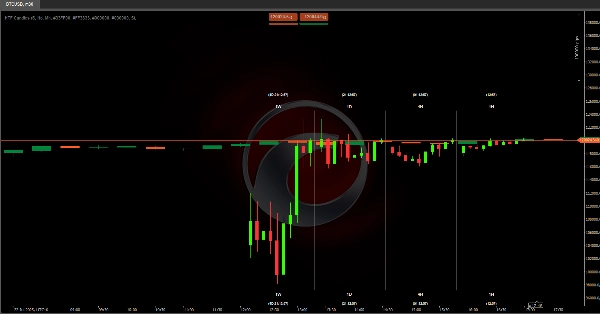
📊 实时高时间框架可视化
该算法直接在您的交易图表上显示更高时间框架的蜡烛图(1周、1天、4小时、1小时),让您一目了然地掌握完整的市场结构 - 无需切换窗口!
🔍 快速分析
在交易较低时间框架时识别主要趋势(日线/周线方向)
• 高级功能: 高时间框架蜡烛图实时更新 - 颜色变化即时显示动量转变
⚙️ 使用方法
• 切换单个高时间框架区块开/关
• 调整可见蜡烛数量(每个时间框架 1-10 根)
💡 改变游戏规则的好处
现在您可以:
1️⃣ 预判关键蜡烛收盘
2️⃣ 实时检测趋势反转
3️⃣ 同时监控多个时间框架的关键水平
🚀 即将改进
水平滚动将实现:
• 历史高时间框架模式分析
• 当前与过去结构对比
• 高时间框架关键区域识别
📚 实用示例
• 当 1周 = 绿色 & 1天 = 红色 → 市场在牛市趋势中调整 → 仅在关键阻力反弹时做空
• 趋势层级: 1周 > 1天 > 4小时 > 1小时 → 始终跟随周线蜡烛方向交易
• 汇合入场:
- 价格在 1天支撑位 + 新出现的绿色 4小时蜡烛 = 多头机会
- 1小时高点阻力 + 红色 4小时蜡烛 = 在高点上方设置止损的空头
• 突破模式: - 如果 1小时蜡烛在收盘前突破前高(计时器激活),预期看涨延续
摘要
Users can toggle individual higher timeframe candle blocks on or off and adjust the number of visible candles per timeframe (1 to 10). This facilitates monitoring of key levels and trend directions across multiple timeframes simultaneously. Practical use cases include anticipating candle closings, detecting live trend reversals, and identifying confluence entries based on support, resistance, and candle color changes.
Due to platform visual constraints, manual zoom and scroll are currently required for optimal viewing, especially on timeframes below 1 hour. Planned updates will introduce horizontal scrolling to enable historical pattern analysis, comparison of current versus past structures, and identification of key zones on higher timeframes.
HTF Candles supports traders in aligning trades with higher timeframe trends and enhances multi-timeframe market analysis within a single chart view.


!["[Stellar Strategies] Wave Trend Pro" 标识](https://cdn.ctrader.com/image/webp/5f226fbb-245a-41cd-9cdd-b018257d5e6d_28617)