Description
🚀 Plus de 10 000 traders utilisent déjà nos indicateurs TOP🏆
Découvrez pourquoi les professionnels nous choisissent – les outils les plus puissants sur cTrader (indicateurs, algorithmes et cBots) vous attendent.
👉 Obtenez tous nos systèmes TOP ici :
_______________________________________________
_______________________________________________
📌 Indicateurs de Structure de Marché
· ✅ AdvancedMarket Structure : Bos, Choch, SwinLevels, Order Blocks, Market Structure& Liquidity Finder
· 🔄 Analyse Dynamique de la Structure du Marché des Points de Renversement
· 🧱 Bloc d'Ordre
· ⛓️ BOS & CHOCH
· 🧠 ICT Power of 3
· 🌀 Zones de Polarité du Marché
______________________________________________________________-
cBots du Store : 🧠 Gold & BTC BreakoutSession Pivots 🧠
_______________________________________________
🔚 Systèmes de Sortie Intelligents
· 📍 Algorithme Intelligent de Trailing
_______________________________________________
📐 Indicateurs ZigZag
· 🔍 Projection de Liquidité du Prix ZigZag
· ➖ ZigZag
· 🎯 Traceur d'Extrémités Zig-Zag
_______________________________________________
🧱 Indicateurs de Support & Résistance
· 🟩 Lignes de Support & Résistance SmartTrend
· 🧱 Tous les Niveaux de Support et Résistance
_______________________________________________
📊 Indicateurs de Tendance & de Canal
· 🔄 Canal de Tendance Automatique
· 📊 Supertrend
· ⚡Analyseur de Tendance Momentum
· 🧠 Canal de Tendance Adaptatif
· 💥 Système de Rupture de Canal
· 🌈 Gradient de Tendance Dynamique
_______________________________________________
💧 Outils de Volume & de Liquidité
· 🔥 Carte Thermique Volume POC
· 📉 Carte de Liquidation à Effet de Levier
· 🕒 Sessions de Fair Value Gap
_______________________________________________
⚡ Indicateurs Momentum & RSI
· 📈 Déclencheur de Tendance RSI
· 🚀 Momentum de Plage Dynamique
· 🔎 Traceur de Biais de Chandelle Multi-Niveaux
_______________________________________________
🔮 Outils de Prédiction & de Projection
· 📐 Prédiction Basée sur Linreg & ATR
· 📏 Régression Linéaire Fibonacci Multi-échelles
· 📈 Projecteur de Flux de Marché Alimenté par le Volume
_________________________________________________________________________________
_________________________________________________________________________________
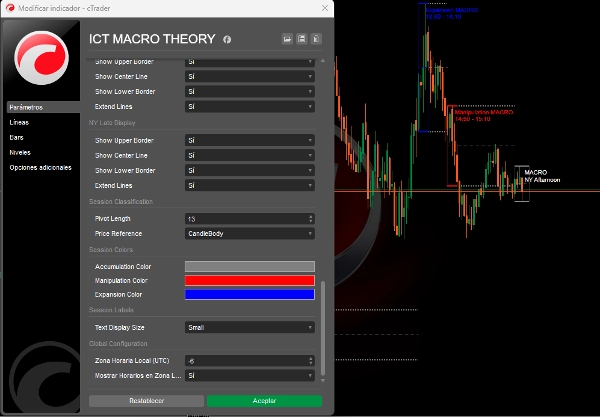
🌐 THÉORIE MACRO ICT
⚠️ NOTE IMPORTANTE : Cet indicateur fonctionne uniquement sur des périodes inférieures à 5 minutes.
Explication des Périodes Macro ICT
Les périodes macro ICT sont essentiellement de courtes intervalles durant lesquels l'algorithme cherche la liquidité ou ajuste le prix pour les écarts de juste valeur. La base de ces macros ICT repose sur la théorie du temps et du prix d'ICT.
Un macro est "une courte série d'instructions qui crée un événement dans la livraison du prix", comme défini par ICT lui-même.
Les macros ICT ne sont pas des stratégies de trading complètes, mais elles peuvent ajouter de la confluence à vos trades et maximiser les profits. Elles se produisent pendant les sessions de Londres, New York, midi et après-midi.
🔮 Implémentation Avancée de la Théorie des Temps Macro ICT :
Connexion Directe aux Concepts ICT :
Le code implémente exactement les 3 types de macros ICT décrits dans la théorie, en utilisant une logique de classification basée sur :
- Analyse de la Structure du Marché :
-
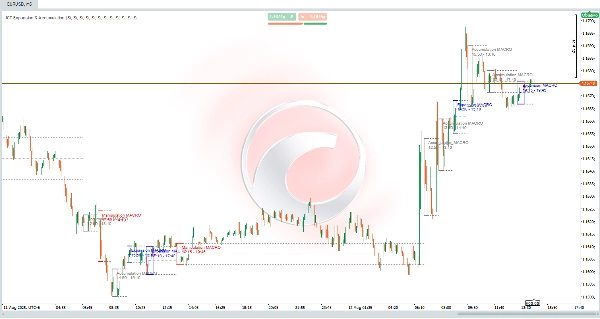
- Détection des Sessions Macro
- Enregistre les heures exactes ICT (Londres 02:33, NY 09:50, etc.).
- Détecte les changements structurels avant et pendant chaque session macro.
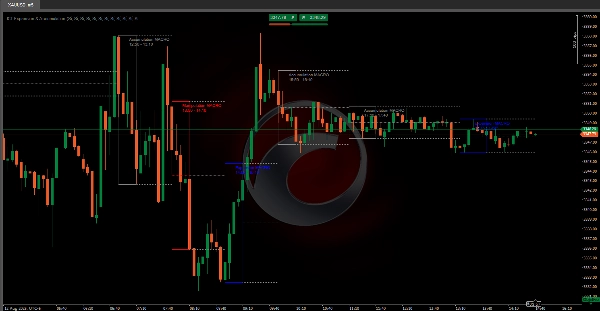
- Classe automatiquement en :
-
- 🟥 Manipulation : Lorsque le prix balaie la liquidité des deux côtés (achat/vente).
- 🟦 Expansion : Mouvements directionnels prenant la liquidité d'un côté (aligné avec la tendance).
- 🟩 Accumulation : Plage étroite où le prix "accumule" la liquidité.
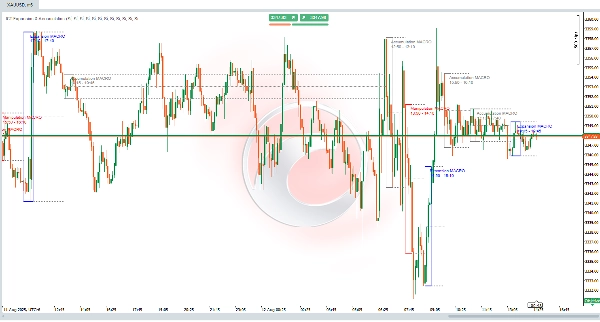
- Niveaux Clés Étendus :
-
- Trace les hauts/bas de chaque session macro.
- Calcule et étend le prix moyen (point médian) à la session suivante.
- Ces niveaux agissent comme support/résistance dynamique (Essentiel en ICT !).
- Détection de Liquidité en Temps Réel :
-
- Utilise des données à 1 minute pour identifier les pivots exacts (comme vus sur des périodes inférieures).
Améliorations & Mises à Jour à Venir :
- Détection des Balayages de Liquidité : Identifiera les balayages de liquidité précédents (hauts/bas du jour/semaine précédents).
- Fair Value Gaps (FVG) : Détectera et visualisera les écarts de juste valeur.
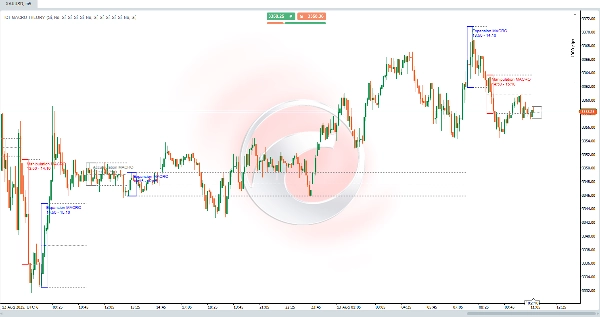
📊 Exemple Pratique ICT
Scénario d'Ouverture NY (09:50-10:10) :
- Pré-session : Le prix balaie la liquidité côté achat (plus bas local).
- Pendant la session :
-
- Classé comme 🟥 MANIPULATION.
- Le prix passe à une structure baissière.
- Post-session :
-
- Les lignes étendues marquent la résistance aux plus hauts de la session.
- Rejet du trade dans la zone avec un RR de 1:3.
✅ Fidèle au Principe ICT :
"Les macros ne sont pas des stratégies complètes mais ajoutent de la confluence en identifiant où les algorithmes chercheront la liquidité."
Résumé
The indicator analyzes market structure and detects key macro sessions—London, New York, midday, and afternoon—recording exact ICT times. It classifies price behavior into three types of macros: Manipulation (price sweeps liquidity on both sides), Expansion (directional movement aligned with trend), and Accumulation (tight range where price accumulates liquidity). It also draws and extends session highs, lows, and average price levels to act as dynamic support and resistance.
Using 1-minute data, ICT MACRO THEORY detects precise pivots for real-time liquidity identification. While not a complete trading strategy, it adds confluence to trades by highlighting where algorithms seek liquidity. Planned updates include detection of liquidity sweeps and visualization of fair value gaps.
This tool is intended for traders seeking to incorporate ICT macro time concepts into their analysis for enhanced market structure insight and liquidity detection on very short timeframes.


![Logo de "[CB] Pivot Points Pro"](https://cdn.ctrader.com/image/webp/43463c82-67b0-4f10-a4ba-901bba091d81_32594)