
Mô tả
▁▂▃▄▅▆▇ █ Hơn 10.000 nhà giao dịch (tổ chức + bán lẻ) █ ▇▆▅▄▃▂▁
- Chọn các chỉ báo TOP của chúng tôi trên cTrader 🏆
- ✨ Độ chính xác độc quyền cho kết quả vượt trội ✨
- 📈 Thuật toán của chúng tôi — với hình ảnh được đánh giá cao nhất 🎯—
- đã được triển khai thành công trong 2 quỹ định lượng
▁▂▃▄▅▆▇ █████████████████████████████ ▇▆▅▄▃▂▁
_______________________________________________
_______________________________________________
📌 Chỉ báo Cấu trúc Thị trường
· ✅ AdvancedMarket Structure: Bos, Choch, SwinLevels, Order Blocks, Market Structure& Liquidity Finder
· 🔄 Phân tích Cấu trúc Thị trường Động về Điểm Quay
· 🧱 Order Block
· ⛓️ BOS & CHOCH
· 🧠 ICT Power of 3
______________________________________________________________-
Kho cBots : 🧠 Gold & BTC BreakoutSession Pivots 🧠
_______________________________________________
🔚 Hệ thống Thoát Thông minh
· 📍 Thuật toán Thông minh Theo Sau
_______________________________________________
📐 Chỉ báo ZigZag
· 🔍 Dự báo Thanh khoản Giá ZigZag
· ➖ ZigZag
· 🎯 Trình theo dõi Cực đoan Zig-Zag
_______________________________________________
🧱 Chỉ báo Hỗ trợ & Kháng cự
· 🟩 Dòng Hỗ trợ & Kháng cự SmartTrend
· 🧱 Tất cả các Mức Hỗ trợ và Kháng cự
_______________________________________________
📊 Chỉ báo Xu hướng & Kênh
· 📊 Supertrend
· ⚡Bộ Phân tích Xu hướng Động lượng
· ⭐ KÊNH SSL CAO CẤP
_______________________________________________
💧 Công cụ Khối lượng & Thanh khoản
· 🔥 Bản đồ Nhiệt POC Khối lượng
· 🔍 Khoảng cách Giá Trị Công bằng Động lượng
· 🕒 Phiên Khoảng cách Giá Trị Công bằng
_______________________________________________
⚡ Chỉ báo Động lượng & RSI
· 🔎 Trình theo dõi Định hướng Nến Đa cấp
_______________________________________________
🔮 Công cụ Dự đoán & Dự báo
· 📐 Dự đoán dựa trên Linreg& ATR
· 📏 Hồi quy Tuyến tính Fibonacci Đa khung thời gian
· 📈 Máy chiếu Dòng chảy Thị trường dựa trên Khối lượng
______________________________________________________________________________________________________
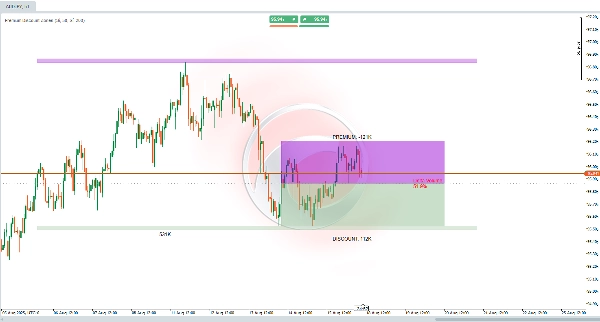
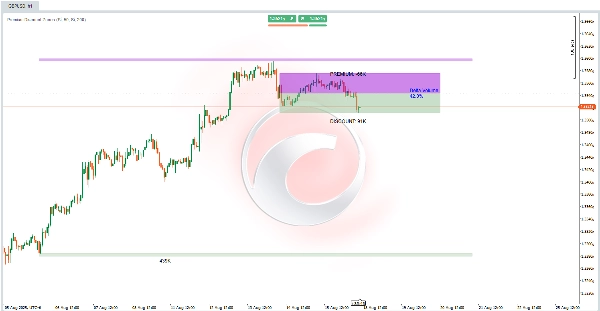
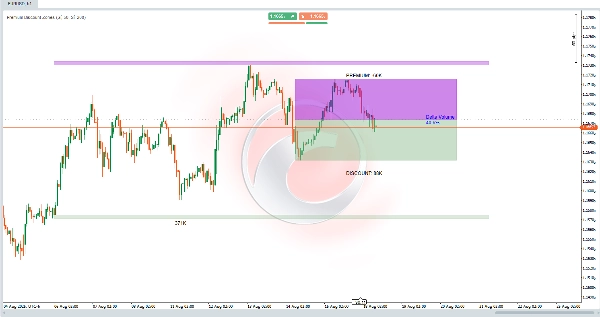
Chỉ báo Vùng Chiết khấu Cao cấp Làm gì? 🎯
Chỉ báo này được thiết kế để giúp bạn xác định các khu vực chính dựa trên các đỉnh và đáy thị trường gần đây. Nó phân tích một khoảng thời gian có thể cấu hình của các thanh trước để xác định phạm vi giá chung, tính toán một điểm cân bằng trung tâm, và chia phạm vi đó thành hai vùng chính:
- 🔺 Vùng Cao cấp (Vùng trên)
- 🟩 Vùng Chiết khấu (Vùng dưới)
Nó cũng đánh giá khối lượng giao dịch trong các thanh đó để tính toán một "Delta Khối lượng", đại diện cho tỷ lệ phần trăm khối lượng liên quan đến các chuyển động giảm giá.
Nó dùng để làm gì? 💡
Chỉ báo này giúp bạn phát hiện các khu vực mà giá có thể:
- 📈 Được định giá quá cao (Vùng Cao cấp) → Có khả năng bán hoặc chốt lời
- 📉 Được định giá thấp (Vùng Chiết khấu) → Có khả năng mua hoặc tích lũy
Nó cung cấp cái nhìn nhanh về mất cân bằng thị trường, làm nổi bật liệu khối lượng gần đây ủng hộ các chuyển động tăng hay giảm. Các vùng cấu trúc mở rộng dự báo các mức chính vượt ra ngoài phạm vi ngay lập tức, hữu ích cho việc lập kế hoạch giao dịch trong xu hướng hoặc đảo chiều. 🚀
Hoàn hảo cho các chiến lược nhắm vào phạm vi hợp nhất, phá vỡ, giao dịch tổ chức hoặc phân tích thanh khoản!
Cách diễn giải nó? 🔍
- 🟣 Vùng Cao cấp (Tím, Trên Cân bằng) → Phạm vi trên, nơi giá được coi là "đắt đỏ."
- 🟢 Vùng Chiết khấu (Xanh lá, Dưới Cân bằng) → Phạm vi dưới, nơi giá được xem là "rẻ."
- ⚖️ Đường Cân bằng (Xám, Giữa) → Đánh dấu điểm giữa phạm vi, đóng vai trò là mức cân bằng. Việc giá cắt qua đây có thể báo hiệu một sự thay đổi xu hướng.
- 📊 Delta Khối lượng (Trung tâm) → Hiển thị tỷ lệ phần trăm khối lượng giảm giá (🔴 >50% = giảm giá, 🔵 <50% = tăng giá).
- 🏛 Vùng Cấu trúc (Phần mở rộng có bóng) → Các khu vực mở rộng trên/dưới các cực của phạm vi, đóng vai trò là hỗ trợ/kháng cự dài hạn với một vùng đệm dựa trên hành động giá gần đây.
Chỉ báo cập nhật động các vùng này trên các thanh gần đây, mở rộng sang bên phải để dự báo tương lai.
Cách sử dụng trong giao dịch? 🛠️
- Cài đặt ban đầu:
-
- Bật các mức PD (chính) và vùng cấu trúc nếu muốn.
- Điều chỉnh khoảng thời gian nhìn lại:
-
- Ngắn (ví dụ, 50 thanh) → Phạm vi gần đây
- Dài (ví dụ, 200 thanh) → Bối cảnh cấu trúc
- Phân tích Biểu đồ (ví dụ, Khung thời gian H1):
-
- Kiểm tra xem giá có nằm trong 🟣 Vùng Cao cấp (xem xét bán khi có xác nhận giảm giá) hoặc 🟢 Vùng Chiết khấu (xem xét mua khi có xác nhận tăng giá).
- Sử dụng Delta Khối lượng để xác nhận:
-
- 🔴 >50% → Ưu tiên bán khống trong Vùng Cao cấp
- 🔵 <50% → Ưu tiên mua dài hạn trong Vùng Chiết khấu
- Chiến lược Vào và Ra:
-
- 🟢 Mua trong Vùng Chiết khấu: Nếu giá vào vùng xanh và delta thấp, tìm kiếm vào lệnh mua dài hạn với điểm dừng dưới mức thấp của vùng và mục tiêu tại cân bằng hoặc Vùng Cao cấp.
- 🟣 Bán trong Vùng Cao cấp: Nếu giá đạt vùng tím và delta cao, cân nhắc bán khống với điểm dừng trên mức cao của vùng và mục tiêu tại cân bằng hoặc Vùng Chiết khấu.
- 🏛 Sử dụng Vùng Cấu trúc cho các giao dịch dài hạn hơn, áp dụng vùng đệm như một biên độ sai số.
Tóm tắt
The indicator also computes a Volume Delta, representing the percentage of volume associated with bearish movements, which helps confirm market bias: values above 50% favor bearish conditions, while values below 50% favor bullish conditions. Extended structural zones project key support and resistance levels beyond the immediate range, useful for planning trades in trending or reversal markets.
Users can adjust lookback periods to focus on recent ranges or broader structural context. The indicator dynamically updates these zones and extends them forward for future projections. It supports trading strategies involving consolidation ranges, breakouts, institutional trading, and liquidity analysis by providing visual cues on price valuation and volume-driven market imbalances.


