
Opis
▁▂▃▄▅▆▇ █ 10 000+ traderów (instytucjonalnych + detalicznych) █ ▇▆▅▄▃▂▁
- Wybierz nasze NAJLEPSZE wskaźniki w cTrader 🏆
- ✨ Ekskluzywna precyzja dla lepszych wyników ✨
- 📈 Nasze algorytmy — z najwyżej ocenianą wizualizacją 🎯—
- zostały pomyślnie wdrożone w 2 funduszach kwantowych
▁▂▃▄▅▆▇ █████████████████████████████ ▇▆▅▄▃▂▁
_______________________________________________
_______________________________________________
📌 Wskaźniki Struktury Rynku
· ✅ AdvancedMarket Structure: Bos, Choch, SwinLevels, Order Blocks, Market Structure& Liquidity Finder
· 🔄 Dynamic Market StructureAnalysis of Turning Points
· 🧱 Order Block
· ⚖️ Market Imbalance
· ⛓️ BOS & CHOCH
· 🧠 ICT Power of 3
______________________________________________________________-
Sklep cBots : 🧠 Gold & BTC BreakoutSession Pivots 🧠
_______________________________________________
🔚 Inteligentne Systemy Wyjścia
_______________________________________________
📐 Wskaźniki ZigZag
· 🔍 ZigZag Price LiquidityProjection
· ➖ ZigZag
_______________________________________________
🧱 Wskaźniki Wsparcia i Oporu
· 🟩 SmartTrend Support &Resistance Lines
· 🧱 All Support and ResistanceLevels
_______________________________________________
📊 Wskaźniki Trendu i Kanału
· 📊 Supertrend
_______________________________________________
💧 Narzędzia Wolumenu i Płynności
_______________________________________________
⚡ Wskaźniki Momentum i RSI
· 🔎 Multi-Level Candle BiasTracker
_______________________________________________
🔮 Narzędzia Prognozowania i Projekcji
· 📐 Prognoza oparta na Linreg& ATR
· 📏 Fibonacci Linear RegressionMulti-timeframe
· 📈 Projektor przepływu rynku zasilany wolumenem
______________________________________________________________________________________________________
SILNIK Prawdopodobieństwa Odwrócenia 🔄
Hybrydowy wskaźnik do wykrywania stref odwrócenia + wielowymiarowa mapa wsparć i oporów „Złote Poziomy”. Łączy analizę struktury (maksima/minima okna Fibonacciego), dynamikę (prędkość i przyspieszenie ceny), entropię/chaos (porządek vs. nieporządek), momentum i wolumen, aby generować:
- Hierarchiczne poziomy wsparcia/oporu według horyzontu czasowego.
- Prawdopodobne sygnały potencjalnego odwrócenia (szczyty i doliny) z % pewności. ⚠️
- Aktywne strefy (prostokąt) do kontekstualizacji transakcji i stopów.
- Klastry konfluencji (gdy wiele ram czasowych pokrywa się na tej samej cenie). 🎯
2. Cel
Zmniejszyć szum wizualny i ułatwić podejmowanie decyzji poprzez identyfikację:
- Gdzie cena była skompresowana lub zakotwiczona na różnych horyzontach.
- Gdzie statystyczne prawdopodobieństwo odwrócenia wzrasta (potwierdzone lub przewidywane). 📊
- Które poziomy mają największą „wagę” (konfluencję).
3. Logika Koncepcyjna
a) Poziomy: Dla każdego okna Fibonacciego pobierane są ostatnie maksimum (R) i minimum (S); daje to fraktalną skalę kontekstów (ultrakrótkie do makro).
b) Fuzja: Jeśli kilka odrębnych poziomów mieści się w X pipsach, są grupowane → klaster z łączną etykietą i licznikiem konfluencji.
c) Sygnały Odwrócenia: Poszukiwane są lokalne wzory wyczerpania (forma fali), zwolnienie (zmiana nachylenia), spadek entropii (niska entropia = bardziej kierunkowy ruch predysponujący do odwrócenia), możliwe dywergencje wewnętrzne oraz potwierdzenia momentum/wolumenu.
d) Tryb Predykcyjny: Pozwala przewidywać odwrócenia (diament) przed pełnym potwierdzeniem, jeśli przeciwne przyspieszenie + niska entropia + stan ekstremalny się pokrywają. 💎
e) Prawdopodobieństwo: Znormalizowane ważenie różnych czynników (trend, chaos, momentum, wolumen, dywergencja, adaptacja). Wynik obcięty 40–99%.
f) Aktywna Strefa: Po sygnale poszukuje się najbardziej logicznego zakresu (pomiędzy odpowiednimi poziomami) do zarządzania transakcją i kontekstualizacji stopów.
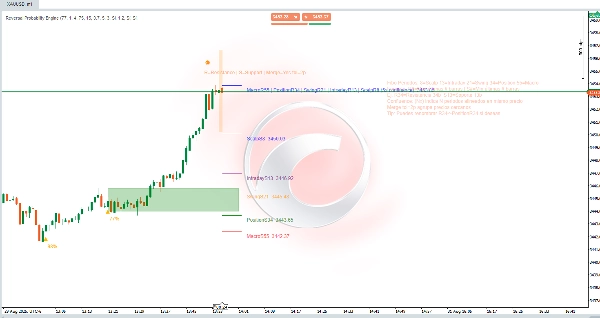
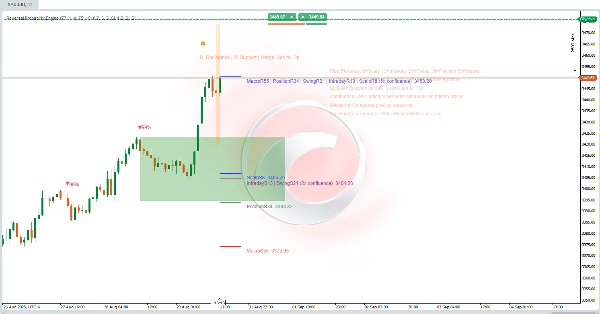
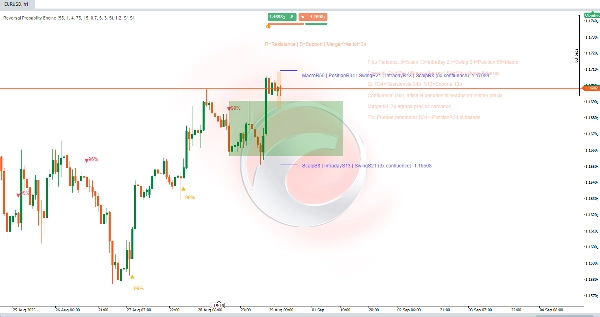
4. Komponenty Wizualne
- Linie poziome: Poziomy według okresu (Scalp 8, Intraday 13, Swing 21, Position 34, Macro 55). Spójny kolor dla każdego horyzontu.
- Etykiety R#/S#: R = Opór (ostatnie maksimum tego okna), S = Wsparcie (ostatnie minimum). Np.: R34 = opór pochodzący z ostatnich 34 świec.
- Scalone Etykiety:
ScalpS8 | IntradayS13 | … (5x konfluencja) Cena. Wskazuje, że N różnych okresów daje ten sam poziom (lub w tolerancji). Im więcej, tym większa trafność. ✅ - (Nx konfluencja): Liczba pokrywających się okresów.
- Merge tol=Xp: Tolerancja w pipsach grupująca bliskie poziomy (zapobiega nasyceniu).
- Prawdopodobieństwa (%): Tekst nad/poniżej trójkątów (Down / Up) lub diamentu (wczesne wykrycie).
- Zielony prostokąt (strefa aktywna): Dynamiczny kanał operacyjny, w którym oceniana jest ewolucja po sygnale.
- Dodatkowe subtelne bloki/kolory: Elementy wsparcia (fale/cząstki) jeśli aktywowane.
5. Praktyczna Interpretacja
- Wysoka konfluencja (≥3x) = silny „magnes” lub poziom zwrotny; obserwuj reakcję ceny. 🧲
- Sygnał + bliska konfluencja wzmacnia ważność (ale nie gwarantuje).
- Prawdopodobieństwo ≥ Min % Pewności: Minimalny filtr do rozważenia działania.
- Rozróżnij Przewidywane (diament) od Potwierdzonego (trójkąt): Przewidywane oferuje lepszy stosunek ryzyka do zysku, wyższy wskaźnik fałszywych sygnałów; potwierdzone przychodzi z mniejszą asymetrią, ale większą walidacją.
- Prostokąt: Jeśli cena pozostaje w środku i nie unieważnia przeciwnego brzegu, teza pozostaje aktualna; czyste przebicie zmniejsza oczekiwania.
- Rozszerz lub zmniejsz MergeTolerance: Mniejsza = większa szczegółowość, Większa = bardziej syntetyczne klastry.
6. Przebieg Użytkowania
- Załaduj wskaźnik na wybrany instrument i interwał czasowy.
- Dostosuj Min % Pewności zgodnie z tolerancją (np. niższy dla scalpingu, wyższy dla swingów).
- Sprawdź, czy pojawia się klaster wsparć/oporów (5x, 4x, itd.).
- Czekaj na sygnał (idealnie, jeśli pojawia się na peryferiach klastra i z wysokim prawdopodobieństwem). 🔔
- Wyznacz zarządzanie w strefie aktywnej: stopniowe wejście lub potwierdzenie nieudanego wybicia.
- Określ logiczny stop: poza pierwszym niższym (w long) lub wyższym (w short) poziomem nieobecnym w konfluencji.
- Dezaktywuj okresy, których nie używasz (np. tylko Swing/Macro dla pozycji długich).
- Dostosuj tolerancję i opcjonalnie ukryj panel wyjaśniający po nauczeniu się.
7. Przykład Szybkiego Odczytu Etykiety
ScalpS8 | IntradayS13 | SwingS21 | PositionS34 | MacroS55 (5x konfluencja)
Znaczenie: Wszystkie ramy czasowe (8–55) dzielą ten sam poziom → wieloskalowe wsparcie strukturalne. Wyższe prawdopodobieństwo reakcji; jeśli utracone z wolumenem, oznacza poważniejszą zmianę reżimu. 🚨
Podsumowanie
Key features include:
- Hierarchical support and resistance levels categorized by time horizons (from ultra-short scalp to macro scales).
- Probabilistic reversal signals indicating potential peaks and valleys with confidence percentages.
- Active zones displayed as rectangles to help contextualize trade entries and stop placements.
- Confluence clusters that highlight price levels confirmed across multiple timeframes, enhancing level significance.
The indicator reduces visual noise by grouping nearby levels within a tolerance range and provides clear visual components such as horizontal lines, labeled resistance/support points, merged confluence labels, probability percentages, and active zones. It distinguishes between anticipated and confirmed reversal signals, offering traders options for risk management and trade timing.
Users can adjust confidence thresholds and merge tolerances to tailor granularity and filtering according to their trading style and timeframe. The tool supports structured decision-making by identifying statistically significant reversal areas and multi-scale support/resistance clusters on any instrument and timeframe.
Opinie klientów
5 | 0 % | |
4 | 0 % | |
3 | 0 % | |
2 | 0 % | |
1 | 100 % |


