
Descrizione
▁▂▃▄▅▆▇ █ 10.000+ trader (istituzionali + retail) █ ▇▆▅▄▃▂▁
- Scegli i nostri indicatori TOP in cTrader 🏆
- ✨ Precisione esclusiva per risultati superiori ✨
- 📈 I nostri algoritmi —con le visualizzazioni più apprezzate 🎯—
- sono stati implementati con successo in 2 fondi quant
▁▂▃▄▅▆▇ █████████████████████████████ ▇▆▅▄▃▂▁
_______________________________________________
_______________________________________________
📌 Indicatori di Struttura di Mercato
· ✅ AdvancedMarket Structure: Bos, Choch, SwinLevels, Order Blocks, Market Structure& Liquidity Finder
· 🔄 Analisi Dinamica della Struttura di Mercato dei Punti di Inversione
· 🧱 Order Block
· ⛓️ BOS & CHOCH
· 🧠 ICT Power of 3
· 🌀 Zone di Polarità di Mercato
______________________________________________________________-
Store cBots : 🧠 Gold & BTC BreakoutSession Pivots 🧠
_______________________________________________
🔚 Sistemi di Uscita Intelligenti
_______________________________________________
📐 Indicatori ZigZag
· 🔍 Proiezione di Liquidità Prezzo ZigZag
· ➖ ZigZag
· 🎯 Tracciatore di Estremità Zig-Zag
_______________________________________________
🧱 Indicatori di Supporto e Resistenza
· 🟩 Linee di Supporto e Resistenza SmartTrend
· 🧱 Tutti i Livelli di Supporto e Resistenza
_______________________________________________
📊 Indicatori di Trend e Canale
· 🔄 Canale di Trend Automatico
· 📊 Supertrend
· ⚡Analizzatore di Trend Momentum
· 💥 Sistema di Breakout del Canale
· 🌈 Gradiente di Trend Dinamico
_______________________________________________
💧 Strumenti di Volume e Liquidità
· 🔥 Mappa di Calore Volume POC
· 📉 Mappa di Liquidazione Leva
_______________________________________________
⚡ Indicatori Momentum e RSI
· 🚀 Momentum Dinamico di Range
· 🔎 Tracciatore di Bias a Candela Multi-Livello
_______________________________________________
🔮 Strumenti di Predizione e Proiezione
· 📐 Predizione Basata su Linreg& ATR
· 📏 Regressione Lineare Fibonacci Multi-timeframe
· 📈 Proiettore di Flusso di Mercato Alimentato dal Volume
______________________________________________________________________________________________________
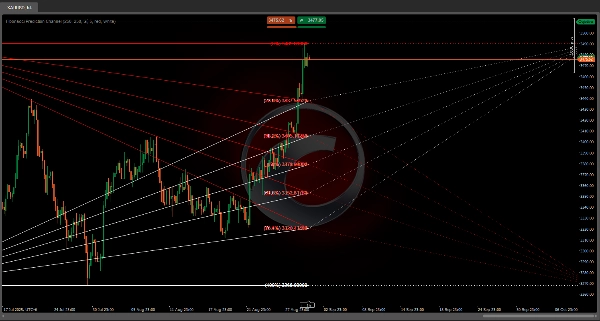
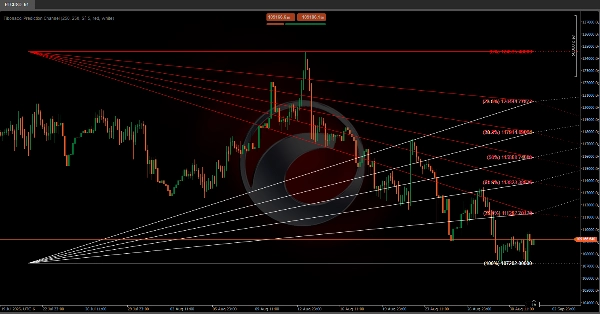
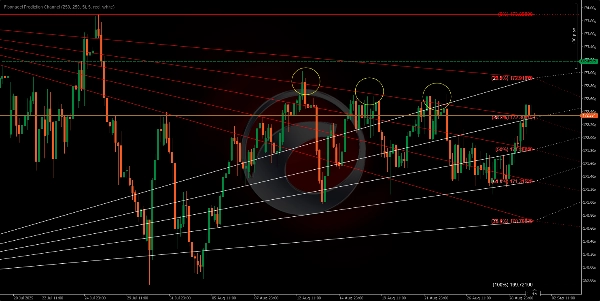
Questo algoritmo è progettato per tracciare un canale di previsione futura basato su livelli di ritracciamento Fibonacci 📊✨. Le linee di Fibonacci creano una serie di canali paralleli tra ogni coppia di livelli consecutivi. Questi canali possono essere interpretati come intervalli entro i quali si prevede che il prezzo fluttui 📈📉, generando un cono visivo dove il prezzo interagirà 🎯. Se un livello viene rotto ⚡, passeremo al successivo.
Questi livelli, che proiettiamo nel futuro, fungono anche da supporto e resistenza 🛡️⚔️, creando canali visivi sul grafico che possono aiutarci ad anticipare e pianificare azioni 🧠✅ basate su come il prezzo ha reagito a questi livelli in passato.
Possiamo aspettarci che il prezzo reagisca avvicinandosi a queste linee 🔍, potenzialmente rimbalzando all'interno del canale 🔄 o, se c'è abbastanza momentum 🚀, superando le linee per passare al canale successivo.
I livelli proiettati verso destra ➡️🗓️ non si basano su nuovi dati di prezzo ma su azioni di prezzo passate ⏳. Si estendono nel futuro come una sorta di "mappa" 🗺️ per potenziali reazioni future del prezzo.
Barre Storiche ⏰: Determina quanti periodi di prezzo passati saranno considerati nel calcolo dei livelli di ritracciamento Fibonacci.


![Logo di "[Hamster-Coder] Moving Average MTF"](https://cdn.ctrader.com/image/webp/b11b98b1-194d-4b8e-b00e-d611826ad159_31226)