설명
이 알고리즘은 고급 기술 도구입니다 🔧 기하학적 가격 패턴(하모닉 패턴)과 가격 움직임을 기반으로 한 시장 구조를 자동으로 감지하도록 설계되었습니다. 주요 목표는 높은 확률의 잠재적 추세 반전 구역 📍을 식별하는 것입니다.
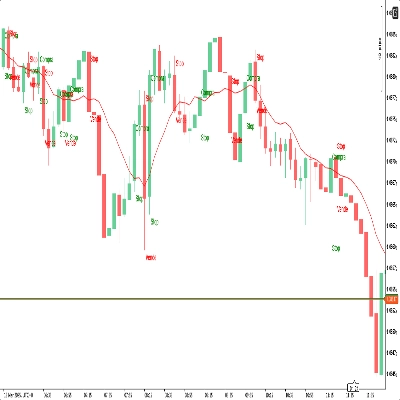
https://chartshots.spotware.com/c/693330cd99c57
이 알고리즘은 무엇을 하나요?
알고리즘은 차트를 실시간 🔍으로 스캔하여 특정 가격 형성을 찾습니다. 두 가지 수준에서 작동합니다:
- 구조 매핑 (지그재그): 먼저, 관련 고점과 저점(피벗)을 연결하는 "지그재그" 선을 그려 시장 노이즈를 단순화합니다. 최대 4가지 다른 길이 📏를 동시에 사용하여 단기 및 장기 추세를 포착합니다.
- 패턴 인식: 이러한 피벗 포인트(점 A, B, C, D, X)가 식별되면 알고리즘은 그 사이의 거리와 비율을 측정합니다. 이 비율이 고전적인 거래 패턴(예: 피보나치)의 수학적 규칙과 일치하면 지표는 패턴을 그리고 사용자에게 알림 🚨을 보냅니다.
용도는 무엇인가요?
복잡한 패턴을 그릴 때 주관성 제거와 분석 시간 절약 ⏳을 위해 사용됩니다. 각 피보나치 되돌림과 확장을 수동으로 측정하는 대신 지표가 자동으로 수행하여 다음을 가능하게 합니다:
- 반전 감지: 가격이 전환될 수 있는 지점(강세에서 약세 또는 그 반대)을 찾습니다. 🔄
- 진입점 식별: 시장에 진입할 정확한 구역("잠재적 반전 구역")을 신호합니다. 🎯
- 분석 확인: 자신의 지지/저항 전략에 대한 추가 확증으로 작용합니다.
계산의 논리
지표의 핵심은 피보나치 비율과 시장 대칭성 ⚖️에 기반합니다. 알고리즘은 각 패턴에 대해 엄격한 규칙을 검증합니다. 예를 들어, "가틀리" 패턴을 확인하기 위해 알고리즘은 내부적으로 다음을 계산합니다:
- 점 B의 되돌림이 XA 구간에 대해 정확히 (또는 매우 근접하게) 0.618인지 여부.
- 점 D의 투영이 특정 비율을 충족하는지 여부.
시장은 정확한 핍 단위로 완벽하지 않기 때문에 지표는 작은 오차 범위(설정 가능)를 허용합니다. 또한 패턴을 표시하기 전에 이론적인 위험/보상 비율을 계산합니다.
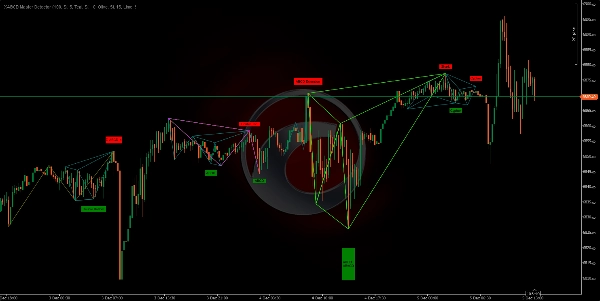
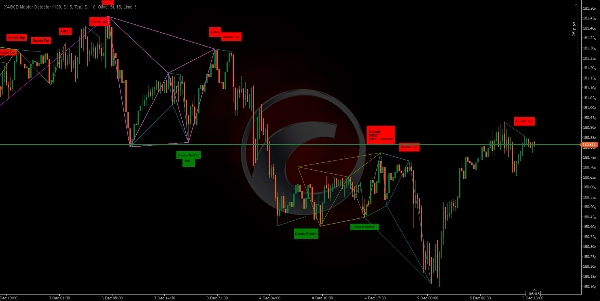
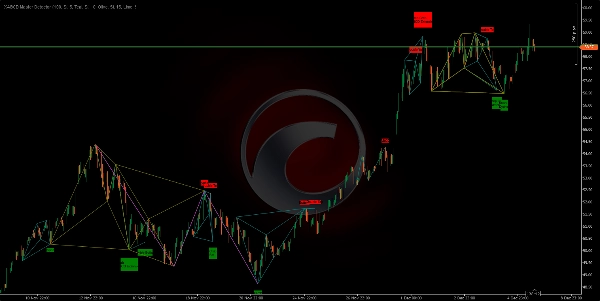
감지하는 패턴:
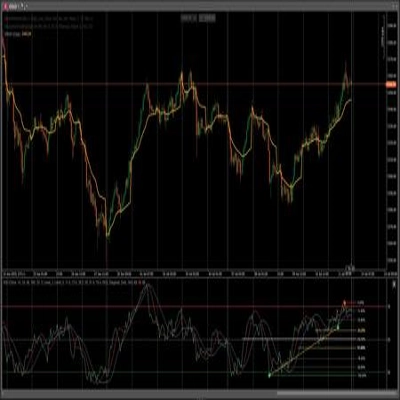
https://chartshots.spotware.com/c/6933314cb9fa1
- 클래식: 더블 탑과 더블 바텀. 🏔️🏞️
- 하모닉: 가틀리, 배트 🦇, 버터플라이 🦋, 크랩 🦀, 딥 크랩, 샤크 🦈, 사이퍼.
- ABCD 구조: 클래식 ABCD, AB=CD, 확장 ABCD.
- 이국적: 쓰리 드라이브, 5-0.
https://chartshots.spotware.com/c/6933317ae4324
사용 방법은?
시각적 설정:
- 봉우리와 골짜기를 연결하는 색상 선을 볼 수 있습니다.
- 패턴이 완성되면 색상이 있는 기하학적 도형과 패턴 이름이 적힌 라벨(예: "가틀리", "더블 탑")이 나타납니다.
- 녹색 라벨: 강세 패턴을 나타내며 매수를 고려합니다. 📈
- 빨간 라벨: 약세 패턴을 나타내며 매도를 고려합니다. 📉
해석:
- 모든 라벨을 맹목적으로 거래하지 마세요. 알림 신호로 사용하세요.
- 패턴이 나타나면, D 구역에서 가격 반응을 기다리세요(패턴의 마지막 점).
- 진입 전에 일본식 반전 캔들 또는 RSI 다이버전스와 같은 추가 확인을 찾으세요.
주요 조정 사항:
- 특정 패턴만 거래하고 싶다면 특정 패턴을 활성화하거나 비활성화할 수 있습니다(예: "배트"와 "가틀리"만). ✅
- 더 빠른 움직임이나 느린 추세를 보기 위해 지그재그의 민감도를 조정할 수 있습니다. ⚙️
🏆 10,000명 이상의 트레이더가 우리의 25개 이상의 알고리즘 제품군을 신뢰합니다! 🏆
시장 구조 및 유동성부터 스마트 종료 시스템 및 예측 도구까지 - 일관된 거래를 위한 모든 도구를 구축했습니다.
👉 25개 이상의 검증된 시스템 모두에 액세스하세요:
_______________________________________________
📌 시장 구조 지표
· ✅ 고급 시장 구조: Bos, Choch, SwinLevels, 주문 블록, 시장 구조및 유동성 탐지기
· 🧱 주문 블록
· ⚖️ 시장 불균형
· ⛓️ BOS 및 CHOCH
· 🧠 ICT 파워 오브 3
· 🌀 시장 극성 구역
_______________________________________________
🔚 스마트 종료 시스템
· 📍 추적 스마트 알고리즘
_______________________________________________
📐 지그재그 지표
· 🔍 지그재그 가격 유동성 투영
· 🧭 S&R 구조적 지그재그
· ➖ 지그재그
· 🎯 지그재그 극한 추적기
_______________________________________________
🧱 지지 및 저항 지표
· 🟩 스마트 트렌드 지지 및 저항선
· 🧱 모든 지지 및 저항 레벨
_______________________________________________
📊 추세 및 채널 지표
· 🔄 자동 추세 채널
· 📊 슈퍼트렌드
· ⚡모멘텀 추세 분석기
· 🧠 적응형 추세 채널
· 💥 채널 돌파 시스템
· 🌈 동적 추세 그라데이션
· ⭐ 프리미엄 SSL 채널
· 🔁 반응형 이동 평균
_______________________________________________
💧 거래량 및 유동성 도구
· 🔥 거래량 POC 히트맵
· 📉 레버리지 청산 맵
· 🔍 모멘텀 공정 가치 갭
· 🕒 공정 가치 갭 세션
_______________________________________________
⚡ 모멘텀 및 RSI 지표
· 📈 RSI 추세 트리거
· 🚀 동적 범위 모멘텀
_______________________________________________
🔮 예측 및 투영 도구
· 📈 거래량 기반 시장 흐름 투영기_________________________
_________________________________________________________________________________________________
_________________________________________________________________________________________________
RSI 채널 트리거: 📶
정의: RSI(기간)를 계산하고 RSI가 과매수/과매도 임계값(기본값 70/30)을 교차할 때 모멘텀 구역을 시각적으로 표시하는 지표입니다. ✅
https://chartshots.spotware.com/c/69278f8b6d973
논리: 임계값이 교차되면 교차 순간 캔들의 고가/저가를 기반으로 "구역"을 생성합니다. 그런 다음: 🧠
- 해당 구역 내의 캔들 색상을 칠합니다.
- 채널(고가, 저가, 중간)을 그립니다.
- RSI 패널에 원과 라벨로 교차를 표시합니다.
구역은 정확히 MinZoneDuration 바 동안 지속됩니다. ⏱️
명확한 신호:
- 과매수 위로 교차 시 강세 구역이 시작됩니다. 🟢
- 과매도 아래로 교차 시 약세 구역이 시작됩니다. 🔴
구역 자체는 관심 영역이지 주문이 아닙니다.
https://chartshots.spotware.com/c/69278fb274e0b
사용 방법 (간단):
- 구역이 형성될 때까지 기다립니다. 🎯
- 가격 움직임(채널 선 돌파/거부)으로 확인합니다.
- 구역 밖에 스톱 로스를 두고 중간 채널 선 또는 정의된 위험/보상 비율에 목표를 설정하여 진입합니다.
https://chartshots.spotware.com/c/69278fe76237b
주요 매개변수: ⚙️
- RSI 기간 (14)
- 과매수 (70)
- 과매도 (30)
- 최소 구역 지속 시간 (15)
- 설정 가능한 색상 🎨
요약
The algorithm recognizes classic and complex patterns—including Double Top/Bottom, Gartley, Bat, Butterfly, Crab, Deep Crab, Shark, Cypher, ABCD structures, and exotic patterns like Three Drives and 5-0—by measuring distances and Fibonacci ratios between pivot points. Upon pattern completion, it visually displays colored geometric figures and labels indicating bullish (green) or bearish (red) signals.
Users can customize pattern detection and ZigZag sensitivity to suit their trading preferences. The indicator supports various markets such as Forex, commodities, indices, stocks, and cryptocurrencies, including symbols like EURUSD, GBPUSD, BTCUSD, XAUUSD, NAS100, and USDJPY.
XABCD Master Detector aims to reduce subjectivity and save analysis time by automatically calculating Fibonacci retracements, extensions, and theoretical risk/reward ratios. It serves as an alert tool to detect reversals, identify entry points, and provide additional confluence to existing support/resistance strategies.
고객 리뷰
5 | 100 % | |
4 | 0 % | |
3 | 0 % | |
2 | 0 % | |
1 | 0 % |