
Support and Resistance Indicators for cTrader
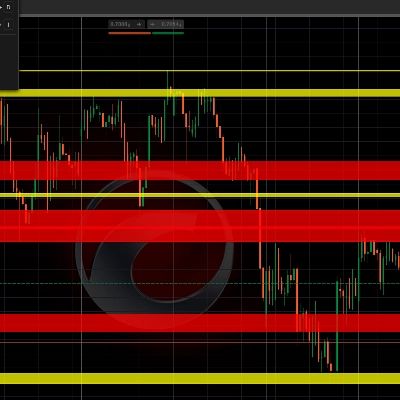
Use support and resistance indicators for cTrader to map key forex price levels more efficiently. These tools help traders identify reaction zones, breakout areas, retests and potential stop or target regions across active currency pairs.
Tools
Tool-Vergleich
Häufig gestellte Fragen (FAQ)

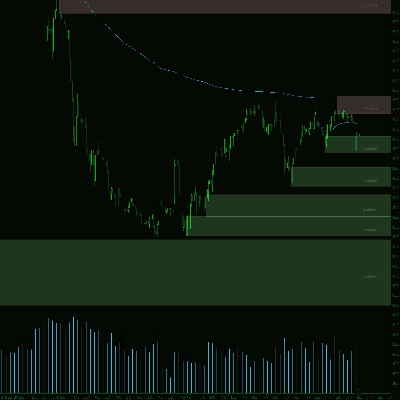
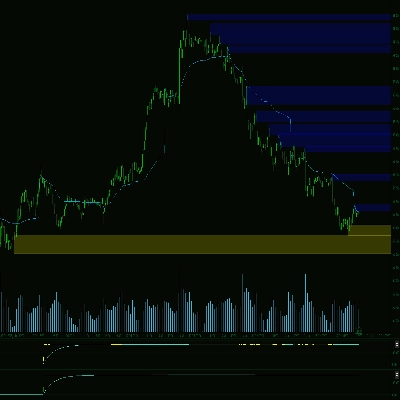

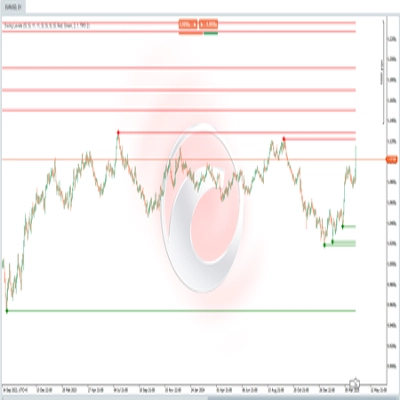
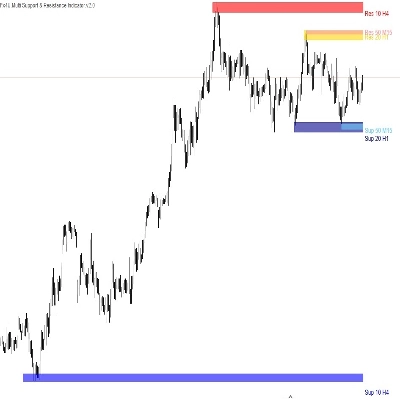

















Tool-Vergleich
Produkt | Bewertungen | Downloads | Verkäufe | Preis | Kompatible Plattformen |
|---|---|---|---|---|---|
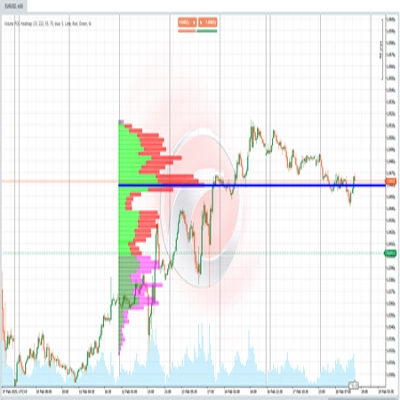
Volume POC Heatmap | 5.0 (4) | 4.14K | — | Kostenlos | Windows, Mac |
Support & Resistance Pro | 5.0 (1) | — | 57 | $19 | Windows, Mac |
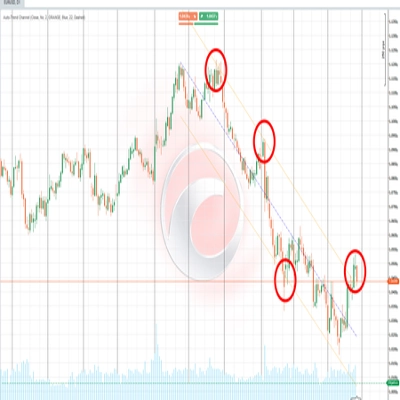
Auto-Trend Channel | 4.4 (5) | 3.08K | — | Kostenlos | Windows, Mac |
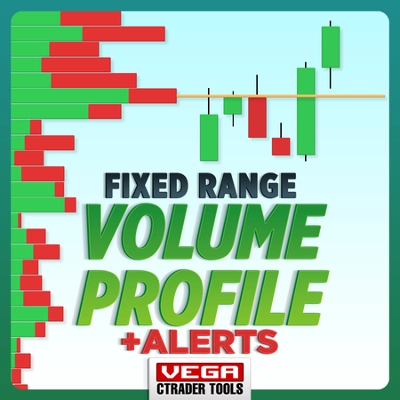
VegaXLR - Fixed Range Volume Profile | 3.5 (4) | — | 50 | $25 | Windows, Mac |
Zones Supply Demand | 3.5 (2) | 2.31K | — | Kostenlos | Windows, Mac |
Supply Demand V1-Premium | 4.3 (3) | — | 14 | $19 | Windows, Mac |
Supply Demand - BasicV1 | 5.0 (3) | 1.38K | — | Kostenlos | Windows, Mac |
LevelMaster SR | 4.5 (2) | — | 10 | $19 | Windows, Mac |
Swing Levels | 4.3 (3) | 1.25K | — | Kostenlos | Windows, Mac |
Fx4U.Multi TimeFrame Support & Resistance | 4.3 (3) | — | 8 | $25 | Windows, Mac |
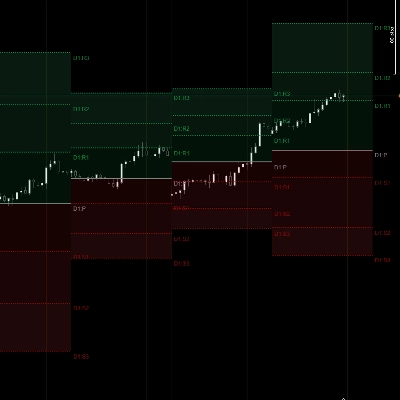
DailyPivotPoints | 5.0 (1) | 1.12K | — | Kostenlos | Windows, Mac |
ZigzagSR | 4.3 (4) | — | 8 | $19 | Windows, Mac |
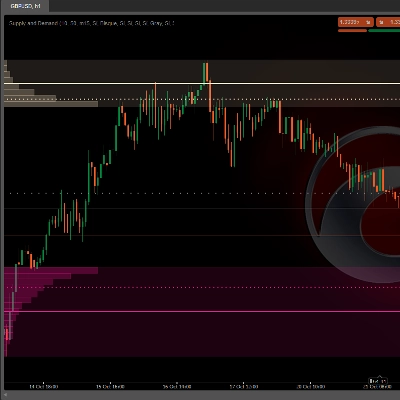
Supply and Demand | 1.0 (1) | 946 | — | Kostenlos | Windows, Mac |
Institutional Bubbles | 4.5 (2) | — | 7 | $38 | Windows, Mac |
HorizontalSupportResistance | 4.5 (2) | 851 | — | Kostenlos | Windows, Mac |
Volume Profile Pro v1.0 | 4.3 (3) | — | 5 | Ab $9 | Windows, Mac |
SmartTrend Support & Resistance Lines | — | 774 | — | Kostenlos | Windows, Mac |
LT_Ind_SRZones | 4.5 (6) | — | 5 | $19 | Windows, Mac |
S&R Structural ZigZag | 5.0 (2) | 701 | — | Kostenlos | Windows, Mac |
Fixed Range Volume profile | — | — | 4 | $19 | Windows, Mac |
Support and Resistance Lite | 4.0 (1) | 627 | — | Kostenlos | Windows, Mac |
Supply&Demand | 4.8 (5) | — | 4 | $19 | Windows, Mac |
Reversal Probability Engine | 1.0 (1) | 591 | — | Kostenlos | Windows, Mac |
Volume Profile Edge Pro | 3.0 (2) | — | 2 | $39 | Windows, Mac |
Previous day Key Levels | 4.5 (2) | 520 | — | Kostenlos | Windows, Mac |
Emperor Pro | — | — | 1 | $49 | Windows, Mac |
MA_Cross_Signal | — | 492 | — | Kostenlos | Windows, Mac |
SmartLevels Pro | 4.3 (3) | — | 1 | $39 | Windows, Mac |
Round Numbers | 4.0 (3) | 455 | — | Kostenlos | Windows, Mac |
PipGrid Pro | — | — | 1 | $20 | Windows, Mac |
SupportResistance | 5.0 (1) | 431 | — | Kostenlos | Windows, Mac |
DrbcLevels | 4.0 (4) | — | 1 | $19 | Windows, Mac |
Master Dragom SR | 5.0 (1) | 424 | — | Kostenlos | Windows, Mac |
Dynamic Bands VWAP | — | — | 1 | Ab $10 | Windows, Mac |
super moving | 5.0 (1) | 423 | — | Kostenlos | Windows, Mac |
Support and Resistance Toolkit | 4.0 (1) | — | 1 | $19 | Windows, Mac |
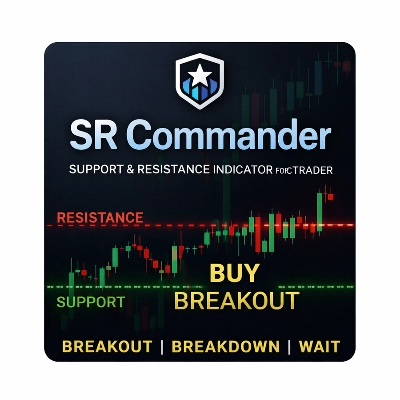
SR Commander | — | 397 | — | Kostenlos | Windows, Mac |
Flux Gate Precision | 4.0 (1) | — | 1 | $29 | Windows, Mac |
Vishal Volume Profile v2.0 | 4.0 (1) | 366 | — | Kostenlos | Windows, Mac |
Malaysian Support AND Resistance | 5.0 (1) | — | 1 | $19 | Windows, Mac |
Volume Spread Analysis | 5.0 (1) | 365 | — | Kostenlos | Windows, Mac |
Market profile Pro V2.1 | 4.0 (1) | — | — | $75 | Windows, Mac |
Smart SR Levels | — | 351 | — | Kostenlos | Windows, Mac |
MyZtrade margin zones | — | — | — | $19 | Windows, Mac |
WeTrades Dynamic Support Resistance | — | 307 | — | Kostenlos | Windows, Mac |
LTtradingBox | — | — | — | $20 | Windows, Mac |
Wejoy Institutional Sessions Elite | 5.0 (2) | 248 | — | Kostenlos | Windows, Mac |
MyZtrade W1 MN zones | — | — | — | $19 | Windows, Mac |
Market Polarity Zones | — | 239 | — | Kostenlos | Windows, Mac |
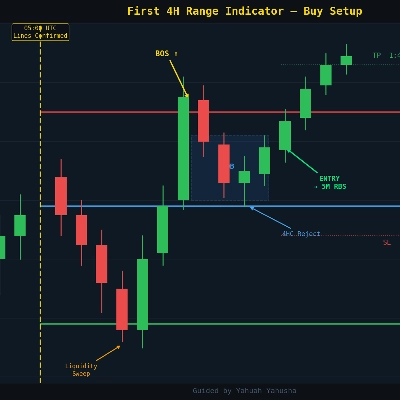
first 4h candle of the day guide yahuah yahusha | 4.3 (3) | — | — | $19 | Windows, Mac |
WeTrades Support Resistance Breaks | — | 235 | — | Kostenlos | Windows, Mac |
Rigid Volume Profile | 4.8 (4) | — | — | $29 | Windows, Mac |
Compare Symbol | — | 227 | — | Kostenlos | Windows, Mac |
Advanced battelzone density heat map | 5.0 (1) | — | — | $19 | Windows, Mac |
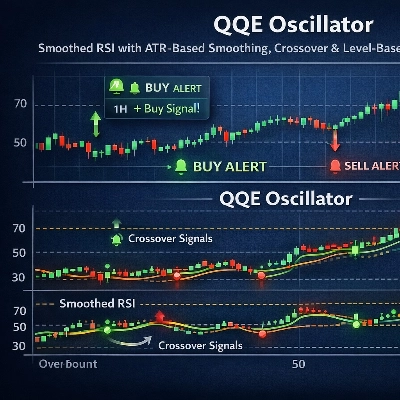
QQE_MTF | 4.0 (1) | 196 | — | Kostenlos | Windows, Mac |
Helix Volume Profile | 4.7 (3) | — | — | $29 | Windows, Mac |
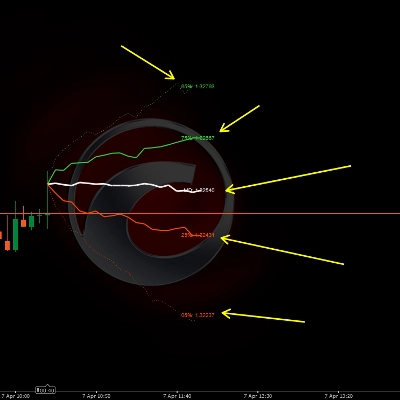
Price Projection Dynamic | 4.0 (1) | 192 | — | Kostenlos | Windows, Mac |
All PivotPoint Pro | — | — | — | $50 | Windows, Mac |
Support Resistance Breaks | 4.5 (2) | 180 | — | Kostenlos | Windows, Mac |
TradingV Fixed Range Volume Profile | — | — | — | $35 | Windows, Mac |
H4 Range - JR | 5.0 (2) | 164 | — | Kostenlos | Windows, Mac |
Reversal Hunter | 4.3 (3) | — | — | $29 | Windows, Mac |
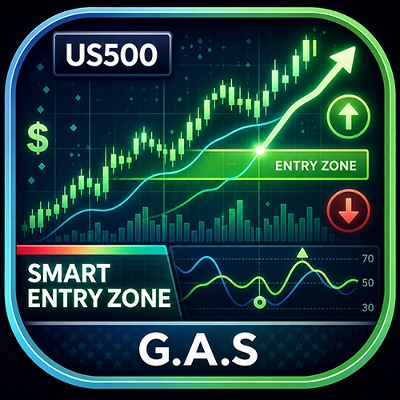
G.A.S - Smart Entry Zone US 500 | — | 144 | — | Kostenlos | Windows, Mac |
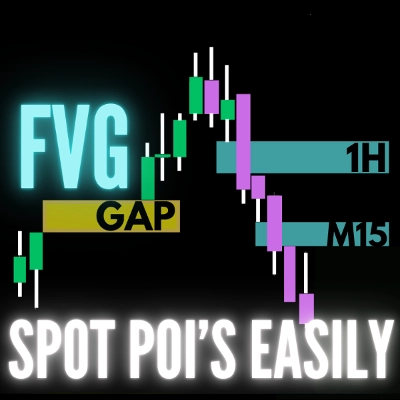
fvg_levels | 4.0 (4) | — | — | $19 | Windows, Mac |
Smart Support Resistance Break Detector | — | 142 | — | Kostenlos | Windows, Mac |
SC Supports and Resistances | — | — | — | $99 | Windows, Mac |
Apex Break PRO | 5.0 (1) | — | — | $29 | Windows, Mac |
PRICE LADDER PRO 3.1 | 4.5 (2) | — | — | $20 | Windows, Mac |
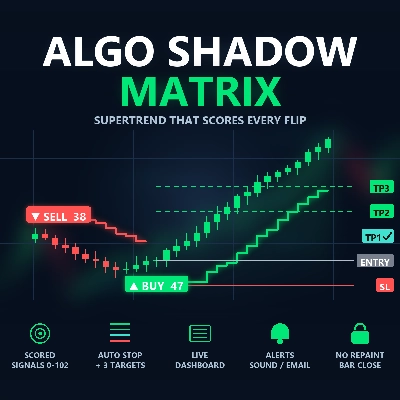
Algo Shadow Matrix | 4.7 (3) | — | — | $29 | Windows, Mac |
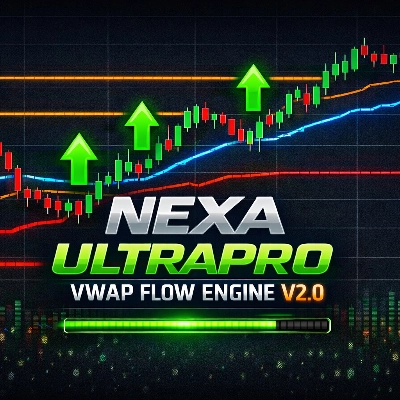
Nexa UltraPro VWAP Flow Engine V2.0 | — | — | — | $80 | Windows, Mac |
FullMarketProfile | 5.0 (1) | — | — | $100 | Windows, Mac |
EGOs HF Zones Drawing Tool | 4.0 (2) | — | — | $19 | Windows, Mac |
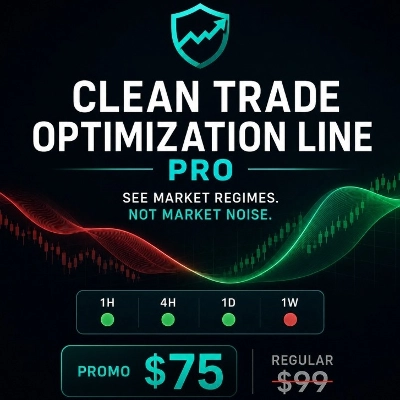
Clean Trade Optimization Line Pro | — | — | — | $19 | Windows, Mac |
ApexMarketStructurePro | — | — | — | $697 | Windows, Mac |
Smart Donchian Cloud | 4.7 (3) | — | — | $19 | Windows, Mac |
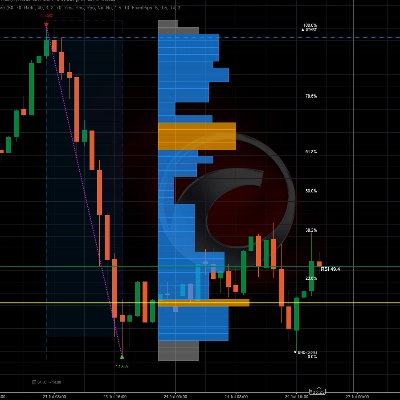
Fixed Range Volume Profile Auto-last swing move | — | — | — | $30 | Windows, Mac |
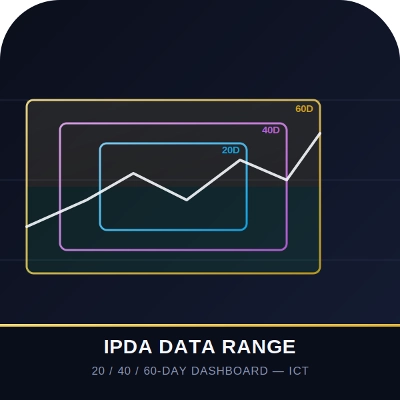
IPDA Data Range Dashboard | 5.0 (1) | — | — | $19 | Windows, Mac |
MyZTrade High TF candle v1.0 | — | — | — | $19 | Windows, Mac |
Flintridge Trader Pro | 4.5 (4) | — | — | $29 | Windows, Mac |
Häufig gestellte Fragen (FAQ)
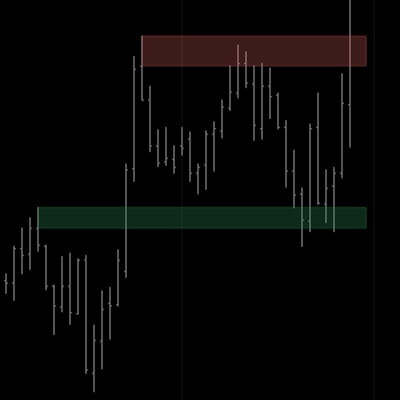
Support is a price area where buying has repeatedly halted declines, and resistance is one where selling has capped rallies. Indicators for these levels usually scan past swing highs and lows, group nearby touches into zones and draw them as lines or shaded bands.
It shows whether a level has switched roles: after price breaks above resistance, traders watch whether that area now holds as support on a pullback. A clean hold is read as acceptance of the break, while a quick fall back inside suggests a false breakout, and neither outcome is certain.
Zones taken from daily or H4 swings summarise more trading than M5 levels, so many traders mark them first and refine entries lower down. On active currency pairs, gold and indices the same approach applies, though very short-term levels break and reform often and add clutter.
Zones come from past swings, so a fresh high or low can shift or erase one, making history look tidier than it looked live. Price can also pierce a zone briefly and return, or break straight through on news, so a level is an area to watch rather than a fixed barrier.
Open it in the Windows or Mac edition of cTrader and scroll back over several symbols and timeframes to see how price reacted. It draws levels and may alert but never places orders, so any trade around a zone is your decision, ideally practised first on a demo account if your broker offers one.